---
title: "Example embedding Tableau into R markdown dashboard"
author: "Scott Spencer"
output:
flexdashboard::flex_dashboard:
orientation: columns
vertical_layout: fill
---
```{r setup, include=FALSE}
library(flexdashboard)
```
Column {data-width=350}
-----------------------------------------------------------------------
### General instructions
This r markdown was just setup from the example template for a flex dashboard (File | New File | R markdown | From Template | Flexdashboard), except that I moved the original right column above the original left column.
A few of you are interested in *embedding* one or more *Tableau graphics* into an R markdown file like this flex dashboard (or any other rmd file, for that matter).
You can do this, but it's a bit finicky, including being able to place and size the graphic precisely into the visual structure of your communication. So it's more complex than either using just Tableau or using just r markdown. Don't lose site of your goals in the interactive communication (as explained in your [instructions](https://ssp3nc3r.github.io/20213APAN5800K007/homework-6.html)) in the process of trying to get some particular technical thing to work. That said, here are the general steps you would need to take to embed a Tableau graphic into something like this rmd/html document.
* **Create** the Tableau graphic and this rmd file
* [**Publish** your group's Tableau graphic or graphics onto Tableau public](https://help.tableau.com/current/pro/desktop/en-us/publish_workbooks_tableaupublic.htm)
* [**Copy** the entire "embed code" from *your group's* graphic on Tableau public](https://help.tableau.com/current/pro/desktop/en-us/embed.htm)
* **Paste** the embed code into your rmd file
* **Format** (carefully) the embed code that you copied and pasted, making sure that `` and `
` and `` tags are all flush-left, like in this document
Now obviously, this example does not try to apply best practices in any of the communication concepts we've discussed this semester as its only purpose is to show you embedding Tableau. Reach out to me with questions.
**Of note**: to see the actual interactive graphic, you will need to open the html file in a browser like Safari or Chrome; in R Studio's Viewer, you'll just see a circle where the graphic will appear.
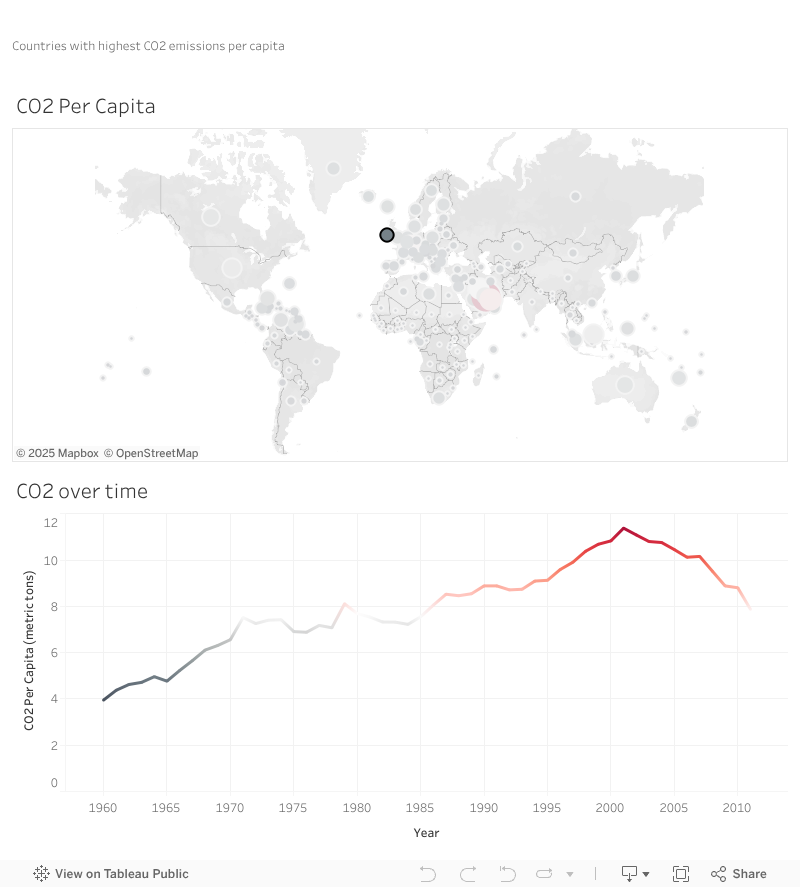
You will find the example of formatted embed code below, from a Tableau public graphic example that Laura created and has embedded on her website, by clicking on her Share button of her graphic and copying the embed code:
### Example *ggplot* graphic
```{r}
library(ggplot2)
ggplot(mtcars) + geom_point(aes(mpg, hp))
```
Column {data-width=650}
-----------------------------------------------------------------------
### Example *Tableau* embedded in flex dashboard