Exploratory modeling on how win uncertainty affects baseball game attendance
We dread an empty ticket booth. The Dodgers’ average game attendance, for example, can be below capacity — they have seats to fill, despite having winning seasons.
To draw more fans, consider the words of famed economist Simon Rotternberg, who said “uncertainty of outcome is necessary for consumers to pay admission to ball games.” While winning is important, it’s the not knowing that creates excitement. Have the Dodgers maximized winning with uncertainty of outcome? Let’s see.
To start exploring the question, we model attendance as a function of the uncertainty of outcome, attempting to account for other factors like day of the week, time of day, and their cumulative fraction of wins. It seems reasonable to believe that some uncertainty helps attract people to the game. It also seems reasonable to believe that the function is non-linear: a change in probability of a win from 0 percent to 1 percent may well attract fewer fans than if from 49 percent to 50 percent. Thus, let’s try modeling the marginal effect of wins as quadratic. Our overall model, then, looks like:
\[\textrm{Normal}(\theta, \sigma)\]
for game \(i\), where
\[\theta_i \sim \alpha_{1[i]} \cdot \textrm{day}_i + \alpha_{2[i]} \cdot \textrm{time}_i + \beta_{1[i]} \cdot \frac{\sum{\textrm{wins}_i}}{\sum{\textrm{games}_i}} + \beta_{2[i]} \cdot p(\textrm{win}_i) + \beta_{3[i]} \cdot p(\textrm{win}_i)^2\] Once we get our posterior estimates, we can set the partial derivative of estimates of win uncertainty (\(\beta_2\) and \(\beta_3\)) to find a maximum:
\[\textrm{Maximum} = \frac{-\beta_2}{2 \cdot \beta_3 }\]
We’ll run the analysis in Stan.
For our analysis, let’s use betting market odds as a proxy for fans’ estimation their teams chances of winning. The betting company Pinnacle has made these data available for the 2016 season in their R package pinnacle.data::MLB2016. As with Pinnacle’s generosity, Retrosheets has made data available for per-game attendance along with game outcomes.
In code, our basic model is as follows:
fit <- stan_glm(Attendence ~ 1 + DayOfWeek + DayNight + winpct + Pr_win + Pr_win2,
data = dodgers2016,
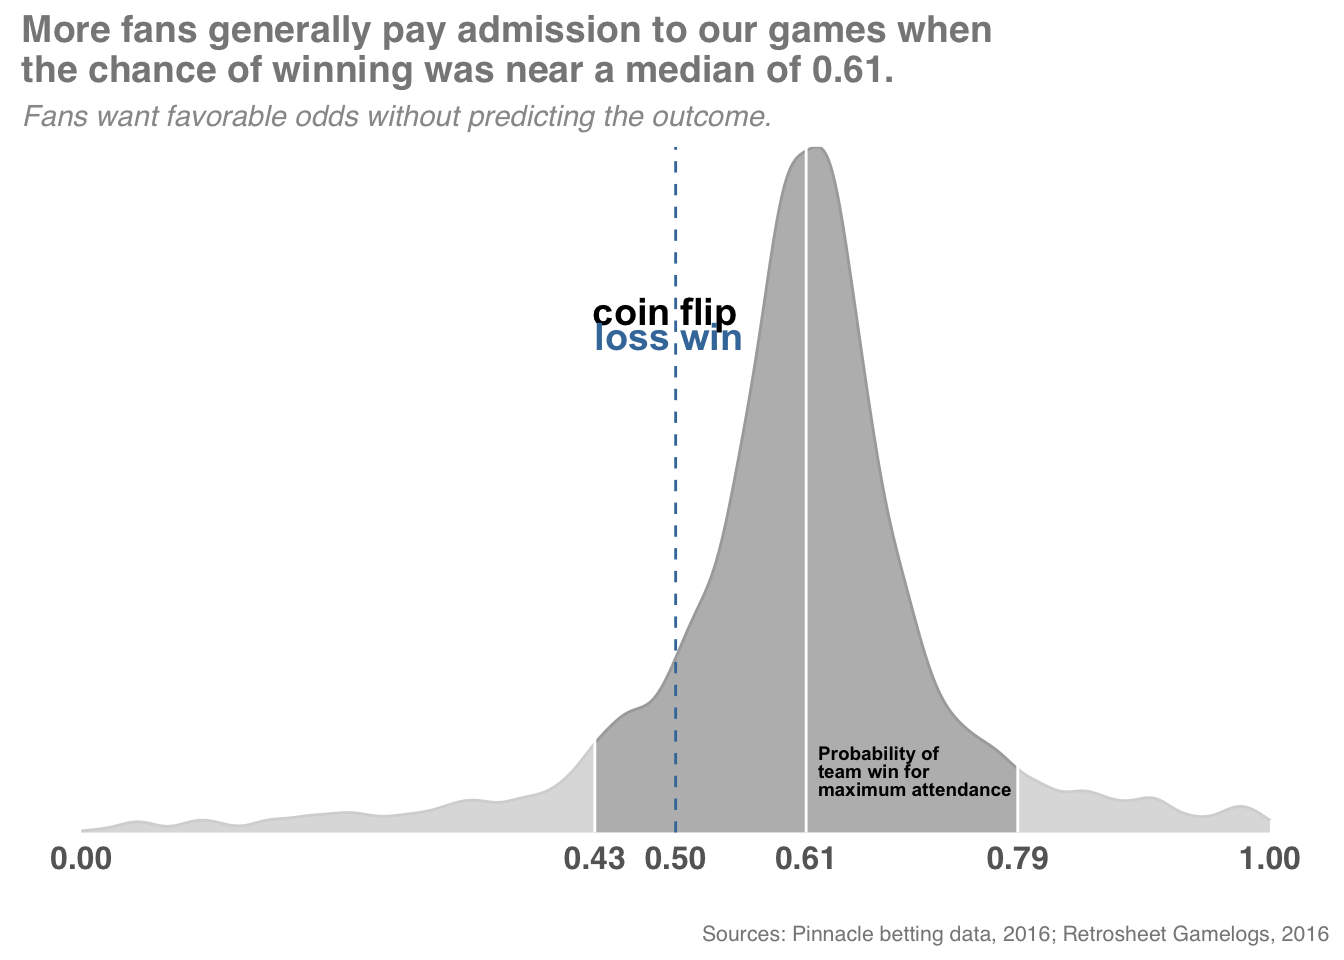
cores = 4, chains = 4)Our resulting estimate for the distribution of the marginal perception of outcome uncertainty that maximizes butts in seats was a median of 0.61 with the distribution: