ggSankeyGrad: an R package to create a ggplot-based sankey graphic that encodes flows with color gradients
ssSankeyGrad returns a ggplot object encoding the flow between beginning and ending categorical data, i.e., a sankey diagram, wherein each flow is encoded as a color gradient. Those color gradients transition between a user-specified color for each category. The parameters are constructed such that c1, c2, col1, col2, and values are all vectors of the same length and corresponding positions represent one flow between categories. The categories c1, c2 are vectors of type character string, col1, col2 are vectors of type character string and include either named colors or hexidecimal representations of color, and values are of an integer or numeric type that encode the amount of “flow” between each category.
To install the function from Github, simply run the following line of code:
devtools::install_github("ssp3nc3r/ggSankeyGrad", ref = "master")In a first example, we setup some dummy data,
library(ggSankeyGrad)

c1     <- c("A", "A", "B", "B")
c2     <- c("C", "D", "C", "D")
values <- c(2L, 5L, 8L, 3L)
col1   <- c("red", "red", "green", "green")
col2   <- c("blue", "orange", "blue", "orange")

ggSankeyGrad(c1, c2, col1, col2, values, label = TRUE)
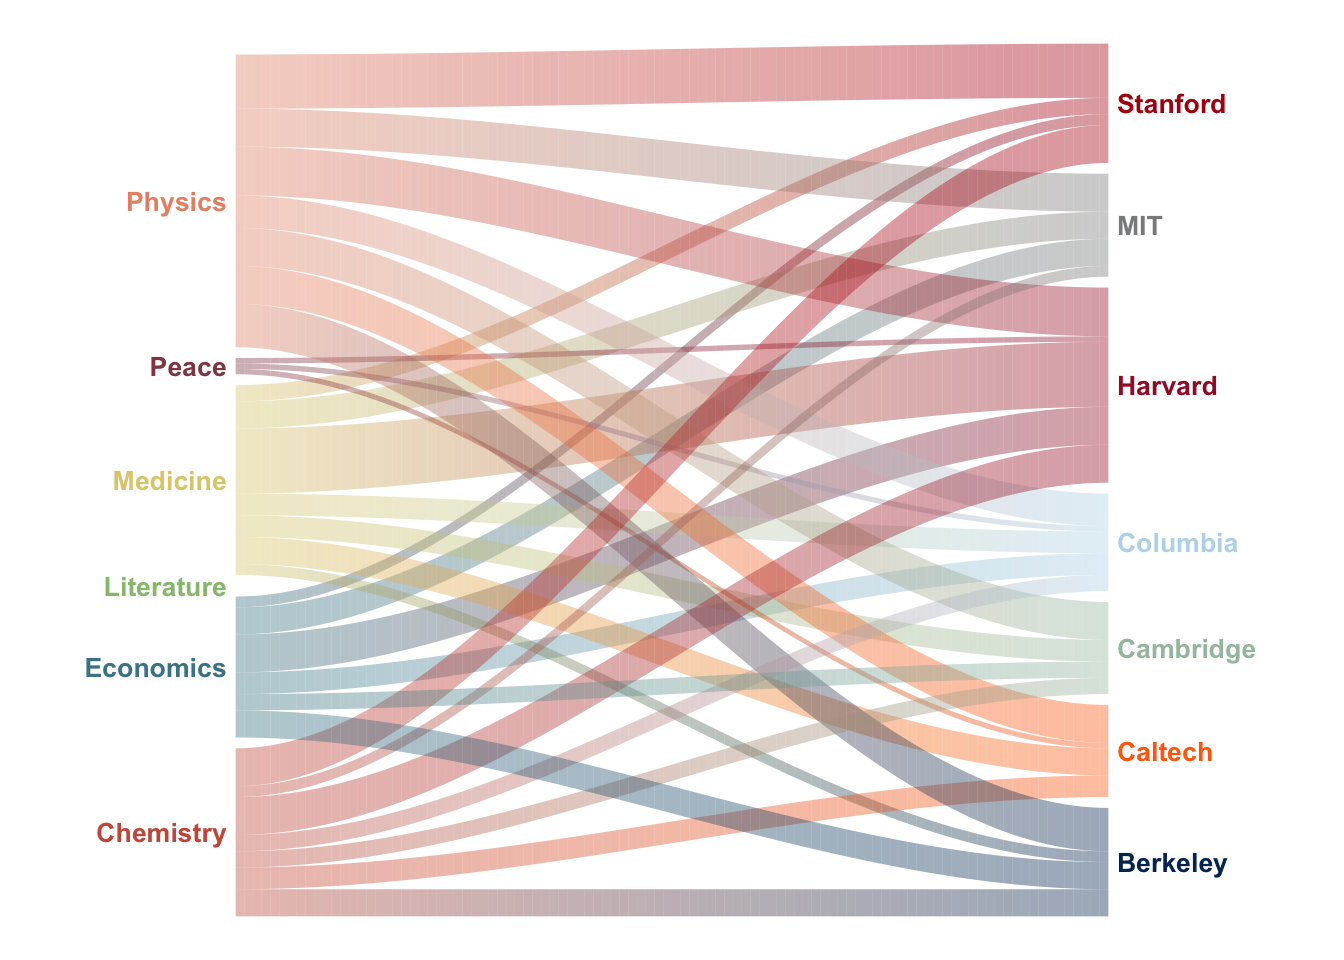
Let’s consider a second example. This data is inspired by Giorgia Lupi’s award-winning infographic, Nobels, No Degrees. We prepare the data in the same format as before, which encodes the categories of Nobel winners and from which of several schools they are associated, if any.
d5 <- read.csv(text = '
"Category","University","n","col1","col2"
"Chemistry","Berkeley",5,"#cc5b47","#003262"
"Chemistry","Caltech",4,"#cc5b47","#FF6C0C"
"Chemistry","Cambridge",3,"#cc5b47","#A3C1AD"
"Chemistry","Columbia",3,"#cc5b47","#B9D9EB"
"Chemistry","Harvard",7,"#cc5b47","#A51C30"
"Chemistry","MIT",2,"#cc5b47","#8A8B8C"
"Chemistry","Stanford",7,"#cc5b47","#B1040E"
"Economics","Berkeley",5,"#488595","#003262"
"Economics","Cambridge",3,"#488595","#A3C1AD"
"Economics","Columbia",4,"#488595","#B9D9EB"
"Economics","Harvard",7,"#488595","#A51C30"
"Economics","MIT",5,"#488595","#8A8B8C"
"Economics","Stanford",2,"#488595","#B1040E"
"Literature",NA,0,"#96c17c",NA
"Medicine","Berkeley",2,"#decd7c","#003262"
"Medicine","Caltech",5,"#decd7c","#FF6C0C"
"Medicine","Cambridge",4,"#decd7c","#A3C1AD"
"Medicine","Columbia",4,"#decd7c","#B9D9EB"
"Medicine","Harvard",12,"#decd7c","#A51C30"
"Medicine","MIT",5,"#decd7c","#8A8B8C"
"Medicine","Stanford",3,"#decd7c","#B1040E"
"Peace","Caltech",1,"#924855","#FF6C0C"
"Peace","Columbia",1,"#924855","#B9D9EB"
"Peace","Harvard",1,"#924855","#A51C30"
"Physics","Berkeley",8,"#e79275","#003262"
"Physics","Caltech",7,"#e79275","#FF6C0C"
"Physics","Cambridge",7,"#e79275","#A3C1AD"
"Physics","Columbia",6,"#e79275","#B9D9EB"
"Physics","Harvard",9,"#e79275","#A51C30"
"Physics","MIT",7,"#e79275","#8A8B8C"
"Physics","Stanford",10,"#e79275","#B1040E"
', stringsAsFactors = FALSE)

with(d5, ggSankeyGrad(c1 = Category,
                        c2 = University,
                        col1 = col1,
                        col2 = col2,
                        values = n,
                        label = TRUE))