Visual exploration of starting pitcher duration
Introduction
This analysis explores major league baseball decisions of when starting pitchers are removed from the game. Baseball, among other wonderful things, is a collection of discrete events measured in time. Fans and analysts alike debate, for example, how long a starting pitcher should remain in a game. More so do managers. In game seven of the 2017 World Series, we witnessed then Los Angeles Dodgers pitcher Yu Darvish removed from the game in less than two innings. On rare occasions, however, starting pitchers complete an entire game. This occurred 59 times during the 2017 MLB regular season. Between these extremes, of course, we find most pitchers.
There is ongoing debate among baseball writers of a so-called times-through-the-order penalty (TTOP): i.e., that familiarity gained from repeated atbats against a particular pitcher give batters an advantage in the matchup. (Lichtman 2013), (Carleton 2016), (Lichtman 2016). Are managers acting on such ideas? If so, we may find evidence of this when modeling.
Discrete time-to-event and censored-event models have been applied to a variety of fields (Tutz and Schmid 2016) but studied less thoroughly in baseball. These models provide an appropriate starting point in describing starting pitcher duration. We aim to contribute to the applied statistical research by describing Bayesian models of starting pitcher duration as measured by the number of batters faced in each game, accounting for the now uncommon but remarkable feat of completing a game (called right-censored because we cannot know how many more batters they would have faced). We build up the models, beginning with the event of removal regressed on only the number of at-bats partially-pooling by pitcher. After comparing the model to a life table, we add factors believed to contribute to removal, including pitching performance measured in runs allowed and home runs accumulated, whether the next batter has a so-called platoon advantage, and so forth. We’ll code the models using R and Stan.
Data for this research is available publicly from MLB Advanced Media, and accessible from R using the package and function pitchRx::scrape(). For this analysis we focus on the 2017 regular season.
With the data from MLBAM, we sequentially number the batters faced within a game for each pitcher, add flags identifying whether the pitcher started the game, whether the pitcher remained in the game to face the next batter (survived), and whether he completed the game (censored). Further, we create variables for exploration, including accumulated runs allowed, accumulated home runs, accumulated baserunners, and whether the next batter is platoon-advantaged.
The transformed and cleaned data are described in Appendix A.
Exploring influence of times-through-the-order on manager decisions
Describing survival with a life table
From the above information, we calculate the hazards (rates of not surviving) as \[\lambda(t|\boldsymbol{x}_t) = P(T=t | T \geq t, \boldsymbol{x}_t) \textrm{, where } t = 1, 2, \dots\]
and the chances of survival are,
\[S(t) = P(T>t) = \prod_{s=1}^{t}{(1 - \lambda_{s})}\]
where period \(t\) is measured as each batter faced.
The results are in Figure 1, which show the chance of survival in blue and the conditional hazard in gray, both including standard errors on the calculations.

Figure 1: Probabilities of hazard (gray) and survival (blue)
The transition for each time through the lineup is marked for reference. Unsurprisingly, we find a nonlinear relationship between batters faced and the chance of facing the next batter. Probabilities are high that pitchers face batters twice through the line up. The largest single increase in conditional hazard coincides with finishing three complete lineups. But well short of pitching through three lineups, the average chance of pitchers remaining is less than 50 percent. We estimate the median number of batters a pitcher faces in a game as,
\[ \textrm{Estimated median batters faced} = m + \left[ \frac{\hat{s}(t_m) - 0.5}{\hat{s}(t_m) - \hat{s}(t_{m+1})} \right] ((m+1)-m) \]
During the 2017 regular seasosn, the median number of batters faced was 23.7, well short of three times through the lineup but — interestingly — we see little evidence here that managers prevent the better batters faced from getting three looks at their starting pitcher. The standard error on these average probabilities are relatively small until surviving pitchers start the fourth time through the lineup.
Another interesting observation, the probability of being pulled drops as surviving pitchers progress through the fourth lineup, though we become less certain with each new batter faced. Perhaps goals shift, and managers leave the pitcher in to allow them to finish the game. The focus to this point has been on the average pitcher survival rates. Let’s turn to modeling.
Modeling survival with conditional logistic regression
Regular regression is inappropriate here as pitchers are pulled from a game against one specific batter (or not at all if they complete the game) conditional on not being pulled from the game beforehand. Conditional logistic regression models are a better starting choice. And we can begin by just regressing the odds of survival on the number of batters faced. We’ll do this using Stan’s Bayesian modeling engine, stratifying the data by game and pitcher.
The first model ignores censored observations (i.e., complete games) and is coded to estimate parameters with Stan’s probabilistic modeling engine.
Among possible priors, we kept it simple and chose normal(0, 0.2) for the coefficients to provide regularization. Model diagnostics look good. Using pareto smoothed importance sampling for leave-one-out approximation, we find that none of the observed stratum exhibit undue influence over the fit (below 0.5 is generally good), shown in Figure 2.
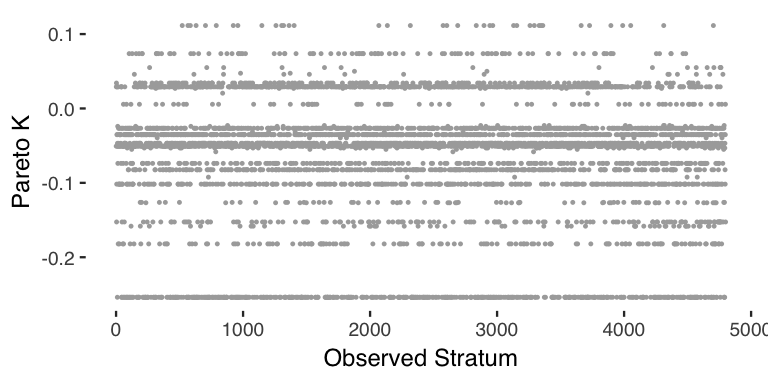
Figure 2: PSIS diagnostic plot
Similarly, the \(\hat{r}\) values and \(\widehat{\textrm{neff}}\) sample sizes show no signs of problem. Transforming the coefficients with an inverse logit, their range of probabilities of pitchers being pulled with each batter faced is shown in Figure 3.
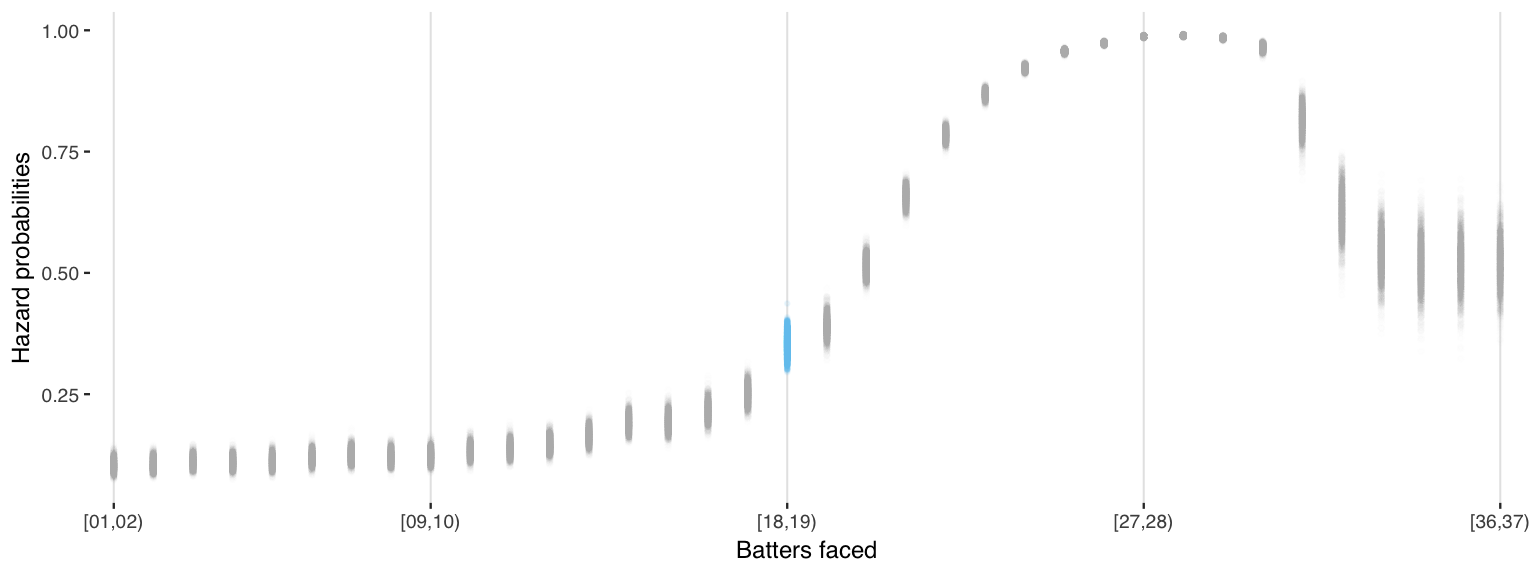
Figure 3: Fit clogit 1 model, inverse logit of coefficients
More nuance in these priors would likely lead to a better fit. Their influence can be seen in the difference between conditional probabilities of the life table with those modeled. The general nonlinear increase in the probability that managers replace the starting pitcher before the next pitch is expected. And the late game decrease in both probability and certainty of being replaced conditional on lasting to late innings is consistent with a shift in goals that allows the pitcher to earn a complete game.
The small bump in probability shown blue in Figure 3, barely noticable with the life table in Figure 1, is still only the slightest of evidence that managers ever heed any times-through-the-order penalty (TTOP). Because, if it is familiarity to avoid, better avoid it against the best opposing batters. Other considerations seem more important.
Exploring game states (context) on pitcher survival
Game state up to each at bat should provide important context. These information may include runs accumulated, baserunners accumulated, identity of the next batter and whether he commands a platoon advantage, pitches accumulated, outs in the half-inning, and changes in pitching effectiveness (e.g., a moving average of balls plus contact). We start by exploring accumulated runs allowed (Darvish, World Series).
Runs accumulated
In Figure 4, boxplots of statistics on runs allowed for pitchers who survived each at bat overlay a bar chart of the relative number of remaining starting pitchers — 4801 started the first atbat, just 2 remained by the thirty-sixth.

Figure 4: Accumulated runs allowed by starting pitchers surviving at each at bat
In comparison, Figure 5 shows boxplots of statistics on runs allowed for pitchers who were taken out at each at bat.

Figure 5: Accumulated runs allowed by starting pitchers taken out at each at bat
Runs allowed by those surviving seem to differ from those taken out. Early in the game — e.g., the first five batters faced — few pitchers are taken out. As such it is difficult to compare. As the game progresses, the mean and interquartile range of pitchers taken out at each at bat in these data are generally higher than those of pitchers surviving during the first and second times through the batting order. Pitchers removed in late at bats have shared survival with those few who still remain until that point, and appear less distinguishable by runs allowed.
Baserunners accumulated
As with accumulated runs allowed, we explore baserunners accumulated by starting pitchers. We count a baserunner for the events: Double, Single, Walk, Home Run, Triple, Hit By Pitch, and Intent Walk. In Figure 6, boxplots of statistics on baserunners accumulated for pitchers who survived each at bat overlay the bar chart of remaining starting pitchers.

Figure 6: Baserunners accumulated by starting pitchers surviving at each at bat
In comparison, Figure 7 shows boxplots of statistics on baserunners accumulated for pitchers who were taken out at each at bat.

Figure 7: Baserunners accumulated by starting pitchers when taken out
Allowing batters on base is intuitively hazardous for starting pitchers.
Outs in the half-inning
We anticipate that pitching changes occur — if possible — between innings. The relative frequencies of pitchers removed on a given number of outs are shown in Figure 8.

Figure 8: Outs when pitcher taken out
While generally consistent with our intuition, these data exhibit more nuance. Pitching changes between innings (after three outs) occur with increasing frequencies as pitchers approach the third time through the batting order, and thereafter decrease only somewhat. This makes sense as earlier in the game, unexpected performance issues may demand swift intervention.
Platooned matchups
It seems that for reasons similar to the surprising fact that facing lead (better) batters for a third time did not result in higher probability of removal, we anticipate the prospect of facing an opposite-handed batter (platoon advantage) as tipping the scales toward removal. In Figure 9, the frequencies of starting pitchers taken out before platoon matchups (shown in black) are compared with starting pitchers facing the matchups (shown in gray). Again, these data overlay the bar chart of remaining starting pitchers.

Figure 9: Percentage of pitchers removed before next-batter platoon
When reviewing these statistics, we should consider the underlying sparcity of data representing pitching changes near the beginning and end of games. Of note, these data show a slight declining trend in frequency of platoon matchups within the second and third batting orders, suggesting that some strategy focuses on top-of-the-order changes. To the point at hand, though, if managers are influenced by platooned matchups in removing starting pitchers, its influence is mostly inseparable from interactions with other variables.
Pitch count
The number of pitches thrown before the pitcher is removed tend to have a mean and median near 100, as going deeper into counts is thought to increase injury risk (Bradbury and Forman 2012). Our data so far has been at bat outcomes. In adding data on pitches within each at bat, we’ll also include pitch location at the plate and outcome (e.g., ball, strike, foul) for later use in this analysis.
In these data, the distribution of pitch counts before removal is shown in Figure 10.

Figure 10: Distribution of total pitch counts when starter removed
Our admittedly incomplete sketch of within-game survival rates of starting pitchers suggests that managers do not typically pull pitchers to avoid the debatable existence of a times through the order penalty due to batter familiarity. Instaed, these basic visual sketches suggest that the given contextual performance matters.
Further work
In further work, we model pitching performance as a function of our own flavor of pitching command and review trends in such performance as games progress.
Appendix
Variables as cleaned for these analyses
Definitions of the variables created by MLBAM are available at (Fast 2007).
| variable | missing | complete | n | min | max | empty | n_unique |
|---|---|---|---|---|---|---|---|
| b_height | 0 | 185691 | 185691 | 3 | 4 | 0 | 16 |
| batter_name | 3955 | 181736 | 185691 | 8 | 24 | 0 | 933 |
| gameday_link | 0 | 185691 | 185691 | 30 | 30 | 0 | 2430 |
| o | 0 | 185691 | 185691 | 1 | 1 | 0 | 4 |
| Period | 0 | 185691 | 185691 | 7 | 7 | 0 | 36 |
| pitcher_name | 3699 | 181992 | 185691 | 8 | 24 | 0 | 736 |
| pitching_team | 0 | 185691 | 185691 | 3 | 3 | 0 | 30 |
| variable | missing | complete | n_unique | top_counts |
|---|---|---|---|---|
| batter | 0 | 185691 | 957 | 453: 725, 596: 723, 542: 720, 605: 713 |
| event | 0 | 185691 | 30 | Str: 39946, Gro: 33161, Sin: 26915, Fly: 19829 |
| inning | 0 | 185691 | 19 | 4: 21060, 1: 21019, 6: 21007, 5: 20959 |
| inning_side | 0 | 185691 | 2 | top: 94591, bot: 91100, NA: 0 |
| p_throws | 0 | 185691 | 2 | R: 137853, L: 47838, NA: 0 |
| pitcher | 0 | 185691 | 755 | 519: 886, 429: 867, 453: 860, 593: 859 |
| stand | 0 | 185691 | 2 | R: 109531, L: 76160, NA: 0 |
| variable | missing | complete | n | mean | count |
|---|---|---|---|---|---|
| censored | 0 | 185691 | 185691 | 0.026 | FAL: 180831, TRU: 4860, NA: 0 |
| nb_opposite_hands | 0 | 185691 | 185691 | 0.52 | TRU: 96745, FAL: 88946, NA: 0 |
| start_pitcher | 0 | 185691 | 185691 | 0.62 | TRU: 115139, FAL: 70552, NA: 0 |
| survived | 4860 | 180831 | 185691 | 0.61 | TRU: 110279, FAL: 70552, NA: 4860 |
| variable | missing | complete | mean | sd | p0 | p25 | p50 | p75 | p100 |
|---|---|---|---|---|---|---|---|---|---|
| away_team_runs | 0 | 185691 | 2.5 | 2.69 | 0 | 0 | 2 | 4 | 22 |
| b | 0 | 185691 | 1.42 | 1.25 | 0 | 0 | 1 | 2 | 4 |
| cumHR | 0 | 185691 | 0.7 | 0.94 | 0 | 0 | 0 | 1 | 8 |
| cumOnbase | 0 | 185691 | 6.71 | 4.76 | 0 | 3 | 6 | 10 | 31 |
| event_num | 0 | 185691 | 318.15 | 192.22 | 4 | 156 | 308 | 469 | 1233 |
| home_team_runs | 0 | 185691 | 2.38 | 2.7 | 0 | 0 | 2 | 4 | 23 |
| key | 0 | 185691 | 238.39 | 144.36 | 2 | 116 | 231 | 351 | 922 |
| num | 0 | 185691 | 39.18 | 22.96 | 1 | 20 | 39 | 58 | 146 |
| num_atbat | 0 | 185691 | 9.22 | 7.49 | 1 | 3 | 7 | 15 | 36 |
| runs_allowed | 0 | 185691 | 2.45 | 2.67 | 0 | 0 | 2 | 4 | 23 |
| s | 0 | 185691 | 1.52 | 1.06 | 0 | 1 | 2 | 2 | 3 |
References
Bradbury, John C, and Sean L Forman. 2012. “The Impact of Pitch Counts and Days of Rest on Performance Among Major-League Baseball Pitchers.” Journal of Strength and Conditioning Research 26 (5): 1181–7.
Carleton, Russell A. 2016. “Is There a Times Through The Order Penalty?” https://www.baseballprospectus.com/news/article/28506/baseball-therapy-is-there-a-times-through-the-order-penalty/.
Fast, Mike. 2007. “Glossary of the Gameday pitch fields.” https://fastballs.wordpress.com/2007/08/02/glossary-of-the-gameday-pitch-fields/.
Lichtman, Mitchel. 2013. “Everything You Always Wanted to Know About the Times Through the Order Penalty.” https://www.baseballprospectus.com/news/article/22156/baseball-proguestus-everything-you-always-wanted-to-know-about-the-times-through-the-order-penalty/.
———. 2016. “Does familiarity breed contempt or is fatigue not the best pillow? | MGL on Baseball.” https://mglbaseball.com/2016/02/29/does-familiarity-breed-contempt-or-is-fatigue-not-the-best-pillow/.
Tutz, Gerhard, and Matthias Schmid. 2016. Modeling Discrete Time-to-Event Data. Springer.