libraries
library(gapminder)
library(tidyverse)
library(gganimate)
Slide 10
d <- expand.grid(x = seq(-5, 5), y = seq(-5, 5))
d <- d[-85,]
d2 <- data.frame(
  x = rnorm(20, 2, 0.06),
  y = rnorm(20, 2, 0.06),
  idx = seq(20)
)

p <- ggplot(d) +
  theme_void() +
  coord_equal() +
  geom_point(
    mapping = aes(x, y),
    size = 0.5
  ) +
  geom_point(
    data = d2,
    mapping = aes(
      x = x,
      y = y
    ),
    size = 0.5
  ) +
  transition_time(idx)

animate(
  p,
  duration = 1,
  fps = 20,
  height = 1,
  width = 1,
  units = "in",
  res = 150
)
Slide 11
d <- expand.grid(x = seq(-5, 5), y = seq(-3, 5))
d2 <- expand.grid(x = seq(-5, 5), y = c(-4, -5, -4))
d2$idx <- rep(c(1, 2, 3), each = 11)


p <- ggplot(d) +
  theme_void() +
  coord_equal() +
  geom_point(
    mapping = aes(x, y),
    size = 0.5
  ) +
  geom_point(
    data = d2,
    mapping = aes(
      x = x,
      y = y
    ),
    size = 0.5
  ) +
  transition_time(idx)+
  ease_aes("linear")

animate(
  p,
  duration = 1,
  fps = 20,
  height = 1,
  width = 1,
  units = "in",
  res = 150
)
Slide 15
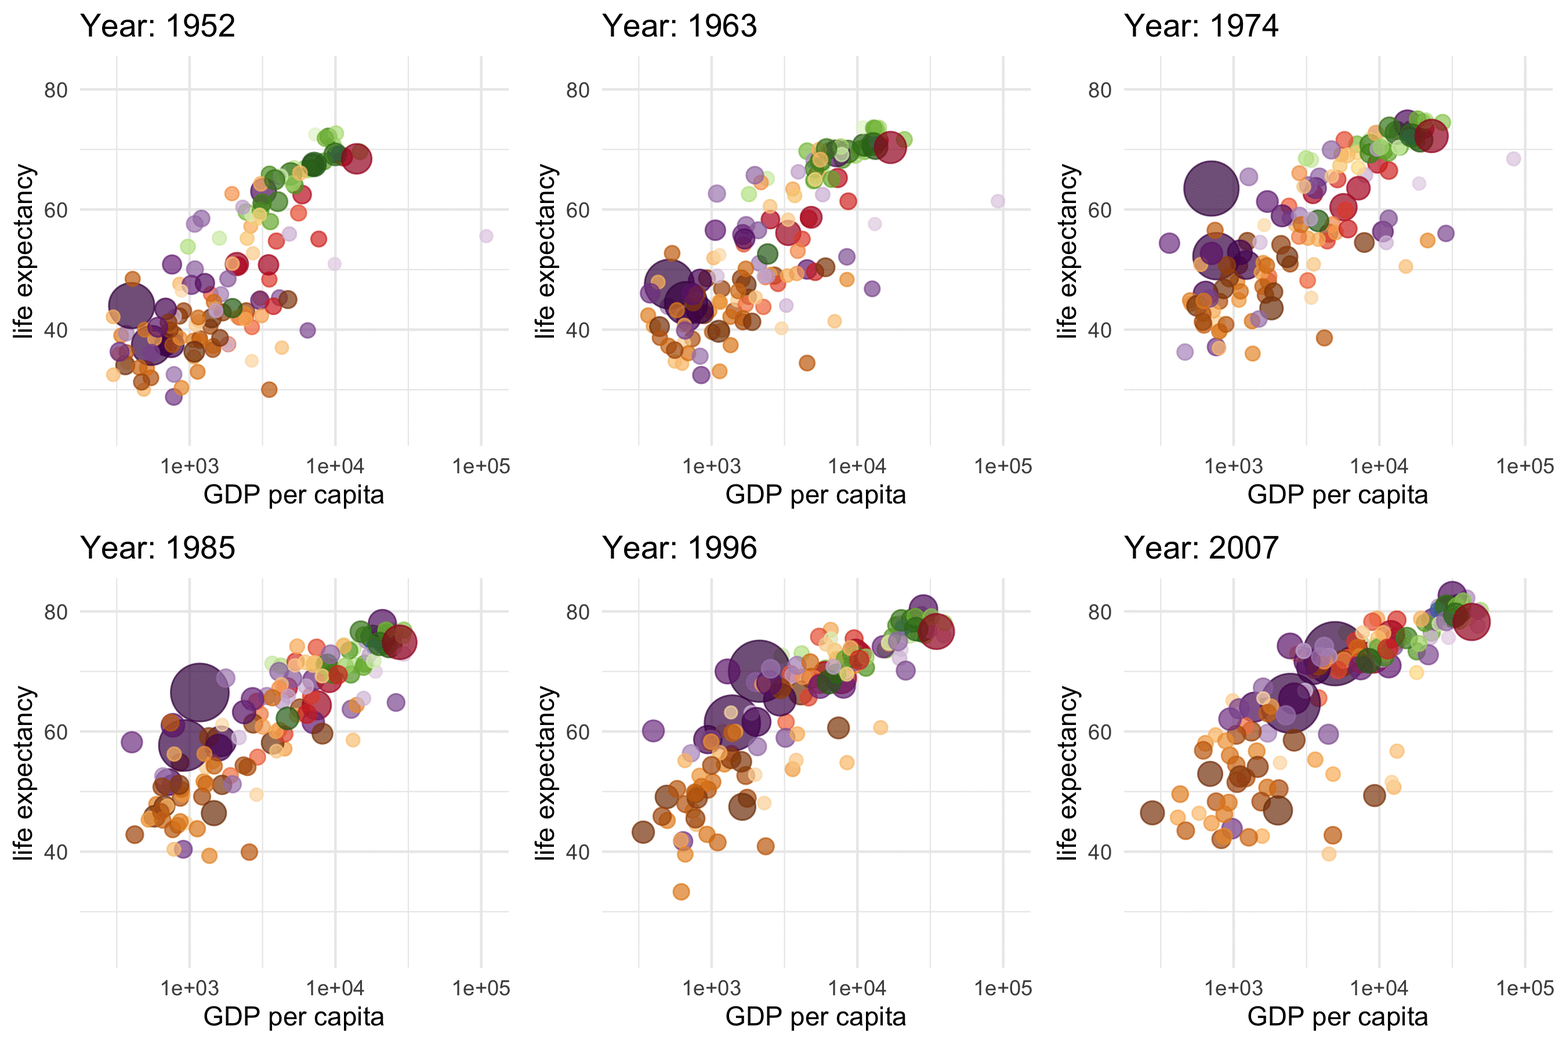
p <- ggplot(
  data = gapminder,
  mapping = aes(
    x = gdpPercap,
    y = lifeExp,
    size = pop,
    colour = country)
  ) +
  geom_point(alpha = 0.7, show.legend = FALSE) +
  scale_colour_manual(values = country_colors) +
  scale_size(range = c(2, 12)) +
  scale_x_log10() +
  labs(
    title = 'Year: {frame_time}',
    x = 'GDP per capita',
    y = 'life expectancy'
  ) +
  transition_time(year) +
  ease_aes('linear')

animate(
  p,
  duration = 10,
  fps = 20,
  height = 3,
  width = 3,
  units = "in",
  res = 300)
Slide 22
The code is on the slide.