4 Persuasion
Should we use data science to persuade others? The late Robert Abelson thought so when he published Abelson (1995). But since then, this question has been under the public eye as we try to correct the replication crisis we mentioned in section @ref(workflow). A special interest group has formed in service of this correction. Wacharamanotham et al. (2018) explains,
we propose to refer to transparent statistics as a philosophy of statistical reporting whose purpose is to advance scientific knowledge rather than to persuade. Although transparent statistics recognizes that rhetoric plays a major role in scientific writing [citing Abelson], it dictates that when persuasion is at odds with the dissemination of clear and complete knowledge, the latter should prevail.
Gelman (2018) poses the question, too:
Consider this paradox: statistics is the science of uncertainty and variation, but data-based claims in the scientific literature tend to be stated deterministically (e.g. “We have discovered … the effect of X on Y is … hypothesis H is rejected”). Is statistical communication about exploration and discovery of the unexpected, or is it about making a persuasive, data-based case to back up an argument?
Only to answer:
The answer to this question is necessarily each at different times, and sometimes both at the same time.
Just as you write in part in order to figure out what you are trying to say, so you do statistics not just to learn from data but also to learn what you can learn from data, and to decide how to gather future data to help resolve key uncertainties.
Traditional advice on statistics and ethics focuses on professional integrity, accountability, and responsibility to collaborators and research subjects.
All these are important, but when considering ethics, statisticians must also wrestle with fundamental dilemmas regarding the analysis and communication of uncertainty and variation.
Gelman seems to place persuasion with deterministic statements and contrasts that with the communication of uncertainty.
Exercise 4.1 How do you interepret Gelman’s statement? Must we trade uncertainty for persuasive arguments? Discuss these issues and the role of persuasion, if any, in the context of a data analytics project.
Critics of using persuasion do not really understand its appropriate use in this context; they sometimes, and incorrectly, assume it means making stuff up, embellishing, or being too emotional. Or they may be incompletely thinking about its use in a particular context, like one party’s viewpoint in a legal dispute. But that is not so. The ideals of law typically ask that different parties present evidence for and against. And a combined, balanced view hopefully emerges from separate parties presentations. Thus, it is common fallacy to consider persuasion in the context of only one party’s view.
Other contexts, such as the very core of our scientific method, relies on persuasion. We must try to understand all relevant evidence and reason about which evidence is more persuasive, and to make decisions from the more persuasive information. Other components to persuasion can help use break down biases that hold authors and audiences from properly considering and reasoning with all the evidence.
To mean anything, data requires context, and the choice of explaining context — what goes in, what stays out; what’s highlighted, or not — is always subjective. But all these choices should be guided by transparent communications, balancing evidence for and against, and preparing audiences to openly and fully consider everything relevant so as to enable decisions, to enable change.
4.1 Methods of persuasion
A means of persuasion “is a sort of demonstration (for we are most persuaded when we take something to have been demonstrated),” writes Aristotle and Reeve (2018). Consider, first, appropriateness of timing and setting, Kairos. Can the entity act upon the insights from your data analytics project, for example? What affect may acting at another time of place mean for the audience? Second, arguments should be based on building common ground between listener and speaker, or listener and third-party actor. This process helps to lessen biases and enable decision makers to be open to all evidence. Common ground may emerge from shared emotions, values, beliefs, ideologies, or anything else of substance. Aristotle referred to this as pathos. Third, Arguments relying on the knowledge, experience, credibility, integrity, or trustworthiness of the speaker — ethos — may emerge from the character of the advocate or from the character of another within the argument, or from the sources used in the argument. Fourth, the argument from common ground to solution or decision should be based on the syllogism or the syllogistic form, including those of enthymemes and analogies. Called logos, this is the logical component of persuasion, which may reason by framing arguments with metaphor, analogy, and story that the audience would find familiar and recognizable. Persuasion, then, can be understood as researching the perspectives of our audience about the topic of communication, and moving from their point of view “step by step to a solution, helping them appreciate why the advocated position solves the problem best” (Perloff 2017). The success of this approach is affected by our accuracy and transparency.
Exercise 4.2 In the Citi Bike memo Example 3.1, identify possible audience perspectives of the communicated topic. In what ways, if at all, did the communication seek to start with common ground? Do you see any appeals to credibility of the author or sources? What forms of logic were used in trying to persuade the audience to approve of the request? Consider whether other or additional approaches to kairos, pathos, ethos, and logos could improve the persuasive effect of the communication.
Exercise 4.3 In the Dodgers memo example Example 3.2, identify possible audience perspectives of the communicated topic. In what ways, if at all, did the communication seek to start with common ground? Do you see any appeals to credibility of the author or sources? What forms of logic were used in trying to persuade the audience to take action? Consider whether other or additional approaches to kairos, pathos, ethos, and logos could improve the persuasive effect of the communication.
Exercise 4.4 In the second Dodgers example — the draft proposal — is the communication approach identical to that in the Dodgers memo? If not, in what ways, if at all, did the communication seek to start with common ground? Do you see any appeals to credibility of the author or sources? What forms of logic were used in trying to persuade the audience to take action? Consider whether other or additional approaches to kairos, pathos, ethos, and logos could improve the persuasive effect of the communication.
Exercise 4.5 As with the above exercises, examine your draft data analytics memo. Identify how the audience may view the current circumstances and solution to the problem or opportunity you have described. Remember that it tends to be very difficult to see through our biases, so ask a colleague to help provide perspective on your audience’s viewpoint. Have you effectively framed the communication using common ground? Explain.
4.2 Accuracy
Narrative arguments must avoid any temptation for overstatement. Strunk and White (2000) warn:
A single overstatement, wherever or however it occurs, diminishes the whole, and a carefree superlative has the power to destroy, for readers, the object of your enthusiasm.
Two prominent legal scholars, one a former United States Supreme Court Justice, agree. Scalia and Garner (2008) explain:
Scrupulous accuracy consists not merely in never making a statement you know to be incorrect (that is mere honesty), but also in never making a statement you are not certain is correct. So err, if you must, on the side of understatement, and flee hyperbole. . . Inaccuracies can result from either deliberate misstatement or carelessness. Either way, the advocate suffers a grave loss of credibility from which it is difficult to recover.
As in law, so too in the context of arguments supporting research:
But in a research argument, we are expected to show readers why our claims are important and then to support our claims with good reasons and evidence, as if our readers were asking us, quite reasonably, Why should I believe that?… Instead, you start where your readers do, with their predictable questions about why they should accept your claim, questions they ask not to sabotage your argument but to test it, to help both of you find and understand a truth worth sharing (p. 109)…. Limit your claims to what your argument can actually support by qualifying their scope and certainty (p. 129) (Booth et al. 2016).
4.3 Transparency
Tufte (2006) explains, “The credibility of an evidence presentation depends significantly on the quality and integrity of the authors and their data sources.”
Be accurate. Be transparent.
4.4 Syllogism and enthymeme
Leaving aside emotional appeals [for the moment], persuasion is possible only because all human beings are born with a capacity for logical thought. It is something we all have in common. The most rigorous form of logic, and hence the most persuasive, is the syllogism (Scalia and Garner 2008).
Syllogisms are one of the most basic tools of logical reasoning and argumentation. They are structured argument, constructed with a major premise, a minor premise, and a conclusion. Formally, the structure is of the form,
All A are B.
C is A.
Therefore, C is B.
Such rigid use of “all” and “therefore” isn’t necessary, what’s necessary is the meaning of each premise and conclusion.
We may sometimes abbreviate the syllogism, leaving one of the premises implied (enthymeme). The effectiveness of this approach depends upon whether your audience will, from their knowledge and experience, naturally fill in the implied gap in logic.
Syllogism and enthymeme are a powerful tool for persuasion. But the persuasive effect may be compromised — as tested experimentally, see (Copeland, Gunawan, and Bies-Hernandez 2011) and (Evans, Barston, and Pollard 1983) — by various audience biases and perceptions of credibility, discussed above. Logic also serves as a building block for a rhetoric of narrative, i.e., a narrative that convinces the audience.
4.5 Narrative as argument
A rhetoric of narrative is logical, but also emotive and ethical (Rodden 2008). It may seem surprising to find argument common in fiction1, and its value grows with non-fiction and communication for business purposes. A rhetorical narrative functions, if effective, by adjusting its ideas to its audience, and its audience to its ideas. The idea, in this sense, includes the sequence of events that demonstrate change or contrast, introduced in section @ref(story). To enable action on an issue, in Aristotle’s words, dispositio, it was essential to state the case through description — writing imaginable pictures — and narration (telling stories) (Aristotle and Reeve 2018).
Exercise 4.6 Consider our two memo examples Example 3.1 and Example 3.2. Do either elicit images in the narratives? Explain. In the Citi Bike memo, what might be a reason for quoting Dani Simmons? Does that reason compare with or differ from how you perceive possible reasons for referencing Sandy Koufax in the Dodgers example?
4.6 Priming and emotion
An introductory story can prime an audience for our main message:
priming is what happens when our interpretation of new information is influenced by what we saw, read, or heard just prior to receiving that new information. Our brains evaluate new information by, among other things, trying to fit it into familiar, known categories. But our brains have many known categories, and judgments about new information need to be made quickly and efficiently. One of the “shortcuts” our brains use to process new information quickly is to check the new information first against the most recently accessed categories. Priming is a way of influencing the categories that are at the forefront of our brains (Berger and Stanchi 2018).
As we make decisions based on emotion (Damasio 1994), and we may even start with emotion and back into supporting logic (Haidt 2001), we can introduce our messages with emotional priming, too. Yet we should be careful with this approach as audiences may feel manipulated and become resistant — or even opposed — to our message.
4.7 Tone of an argument
When trying to persuade, authors sometimes approach changing minds too directly:
Many of us view persuasion in macho terms. Persuaders are seen as tough-talking salespeople, strongly stating their position, hitting people over the head with arguments, and pushing the deal to a close. But this oversimplifies matters. It assumes that persuasion is a boxing match, won by the fiercest competitor. In fact, persuasion is different. It’s more like teaching than boxing. Think of a persuader as a teacher, moving people step by step to a solution, helping them appreciate why the advocated position solves the problem best. Persuasion, in short, is a process (Perloff 2017).
Try gradually leading audiences to act, framing your message as more reasonable among options, compromising, or any combination of these. And about those other options for decisions. Showing our audience that our message is more reasonable among options requires discussing those other options. If we do not discuss alternatives, and our audience knows of them or learns of them, they may find our approach less credible, and thus less persuasive, because we did not consider them in advocating our message.
4.8 Narrative patterns
Stories are built upon narrative patterns (Riche et al. 2018). These include patterns for argumentation, the action or process of reasoning systematically in support of an idea, action, or theory. Patterns for argumentation serve the intent of persuading and convincing audiences. Let’s consider three such patterns: comparison, concretize, and repetition.
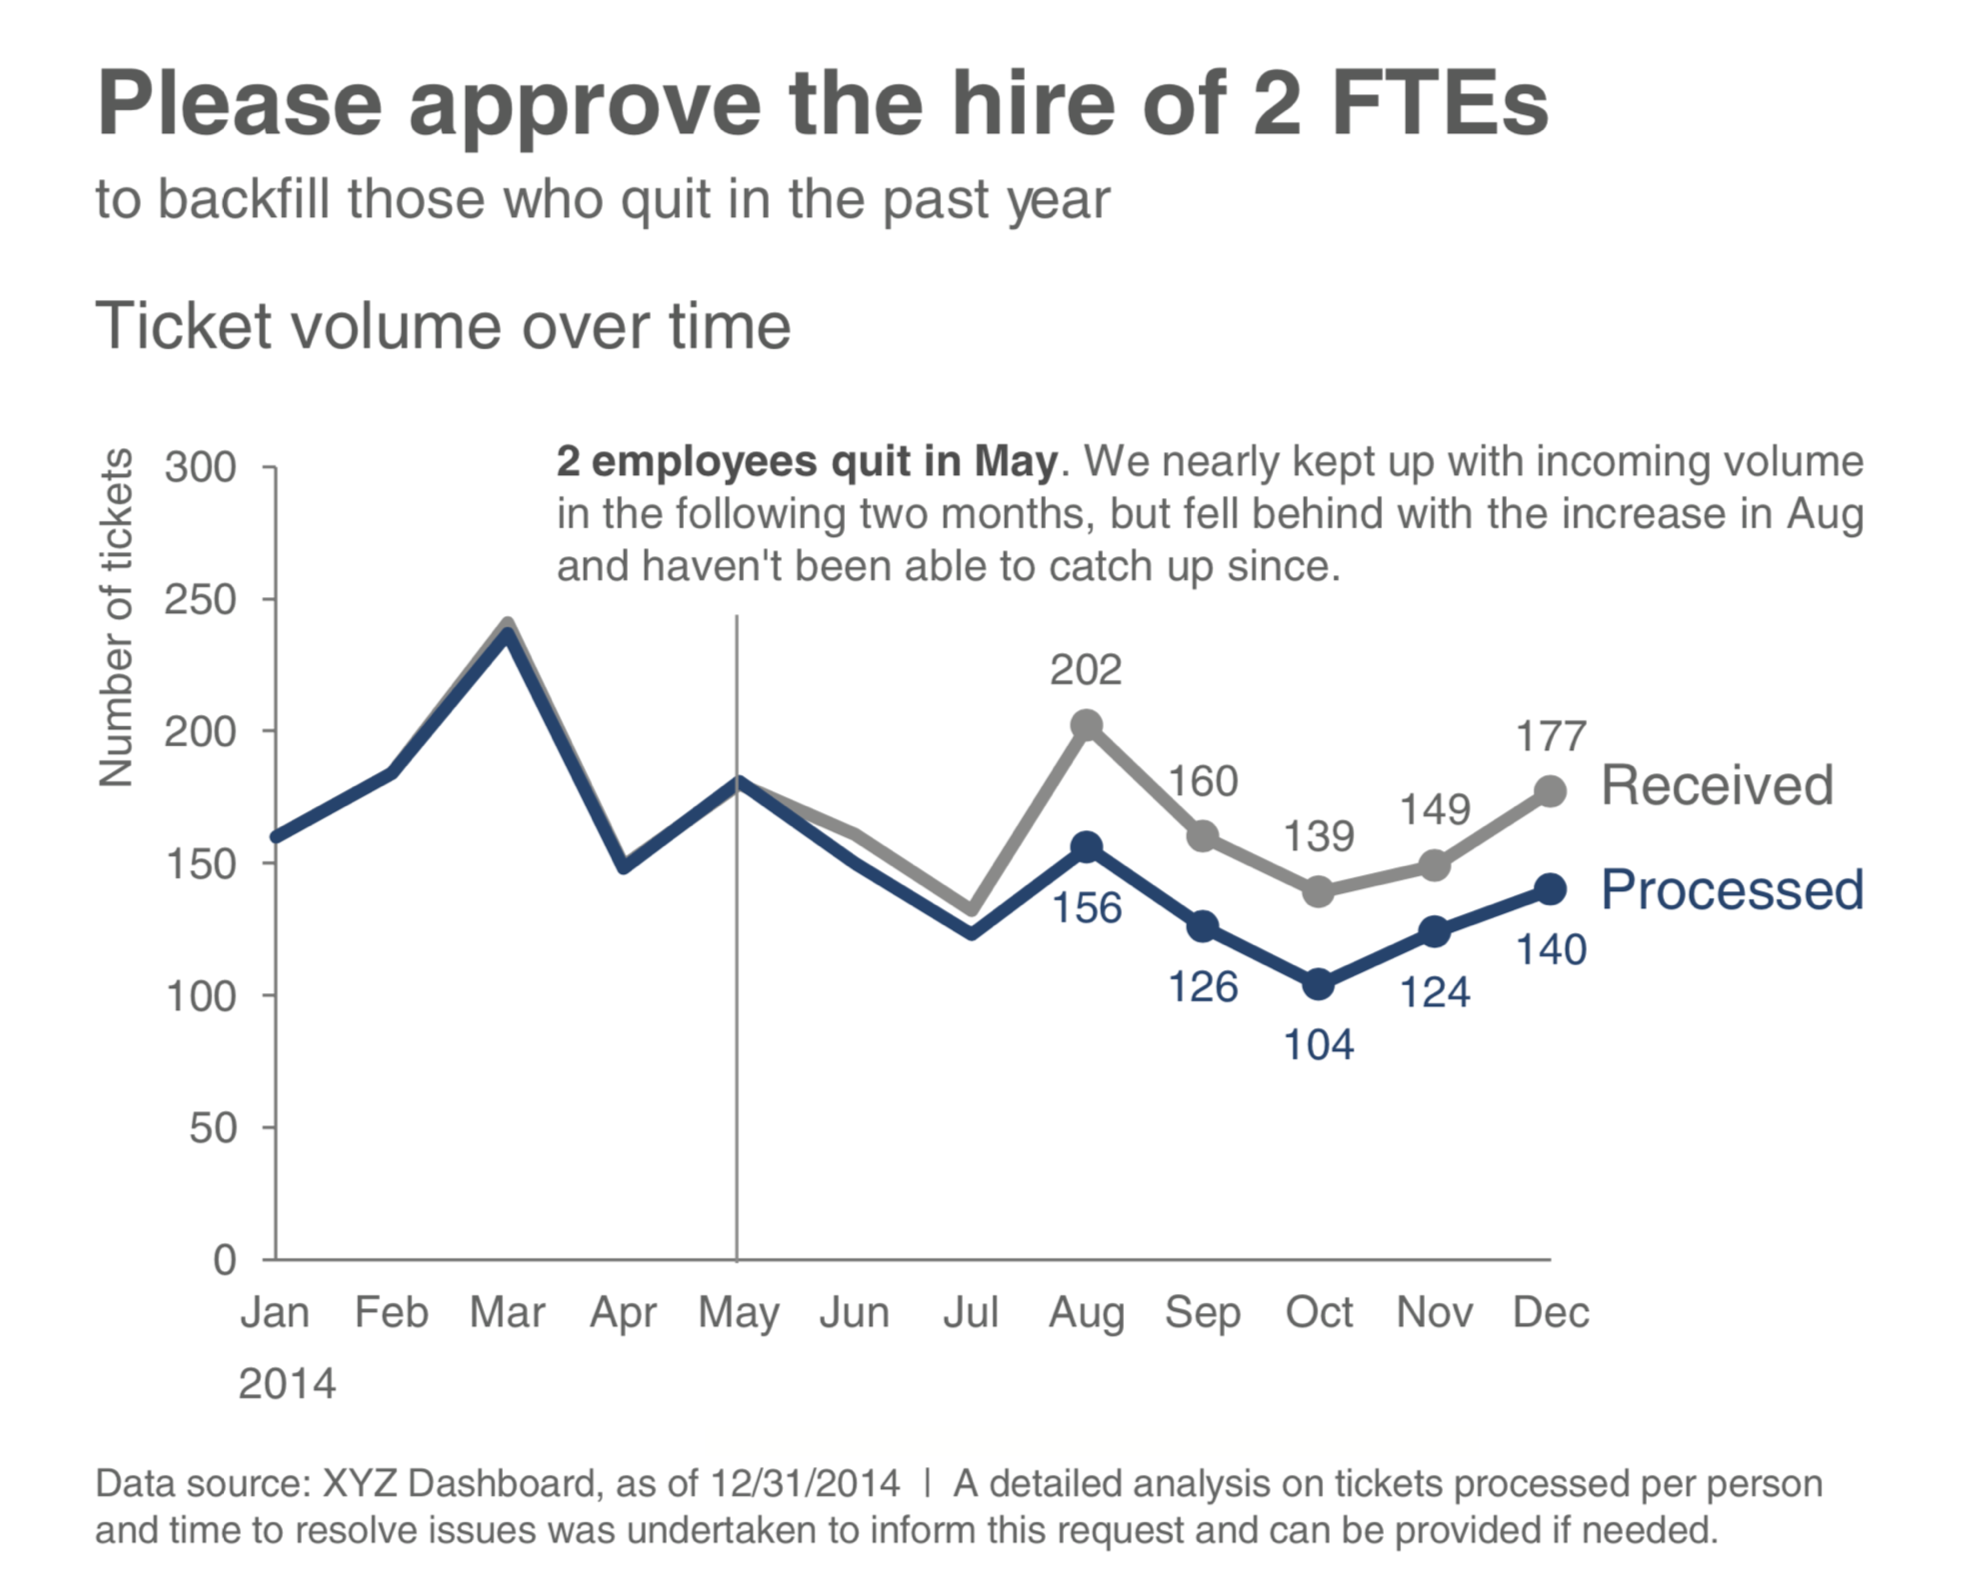
Comparison allows the narrator to show equality of both data sets, to explicitly highlight differences and similarities, and to give reasons for their difference. We have already seen various forms of graphical comparison used for understanding. In (Knaflic 2015), the author offers an example showing graphical comparison to support a call to action, see Figure 4.1.

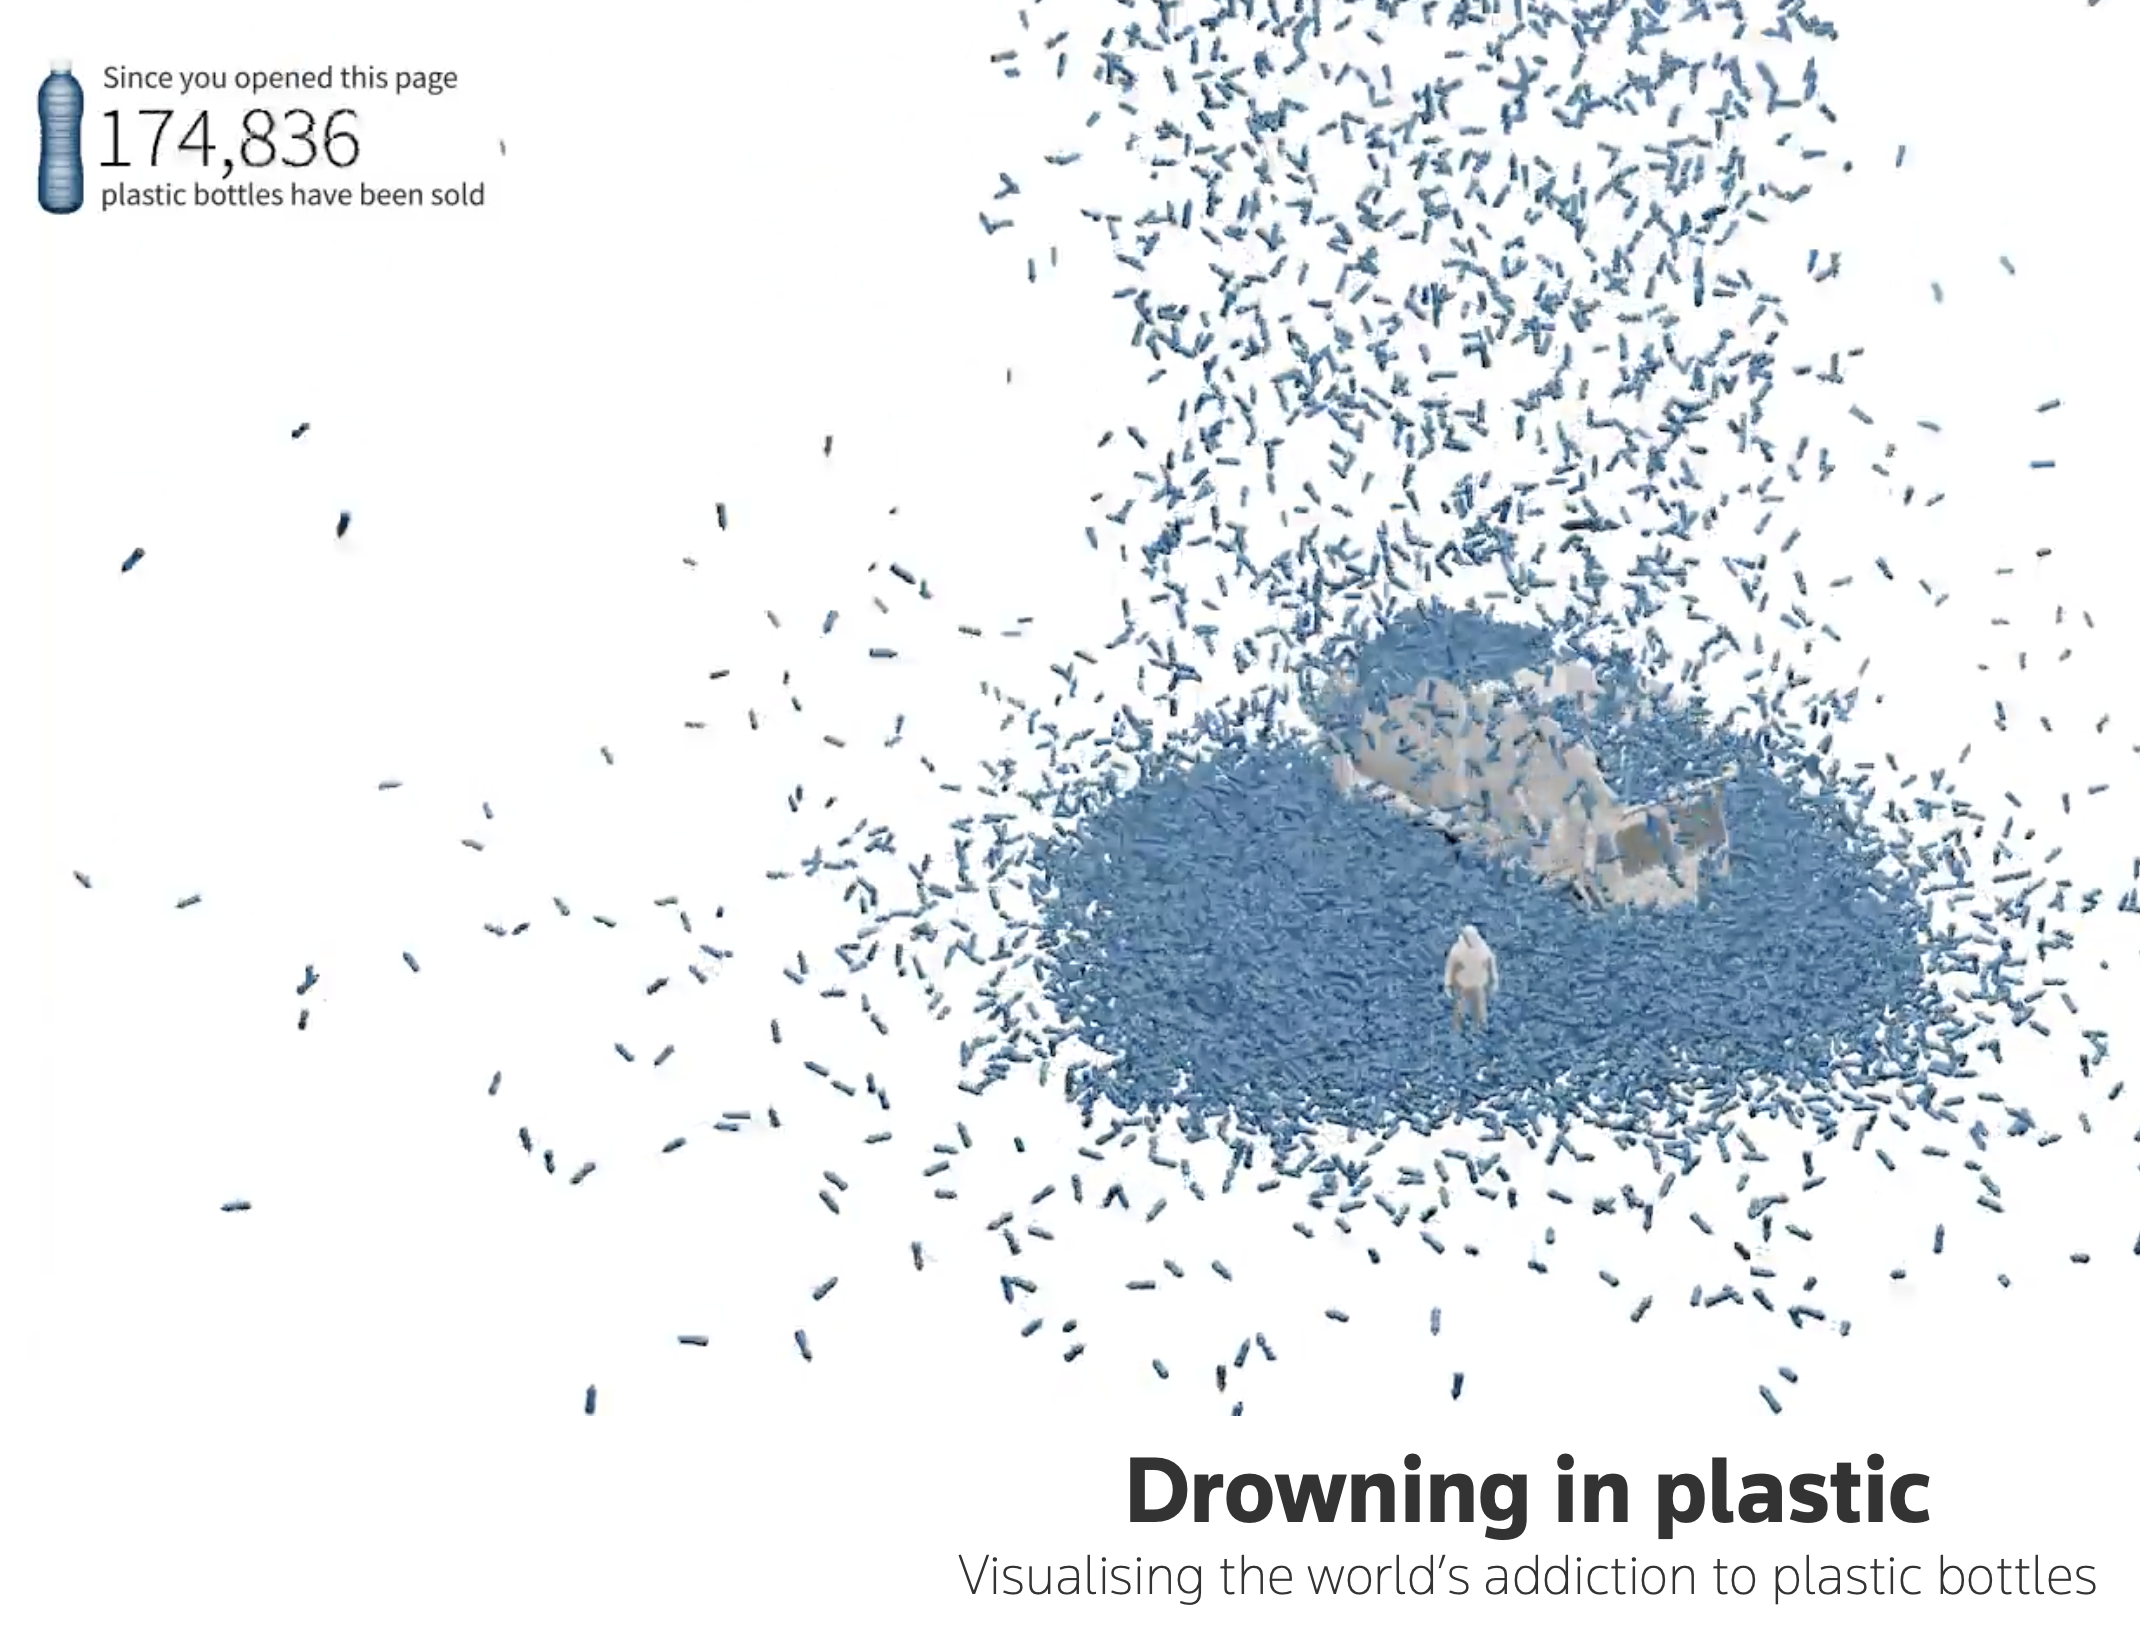
Concretizing, another type of pattern useful in argumentation, shows abstract concepts with concrete objects. This pattern usually implies that each data point is represented by an individual visual object (e.g., a point or shape), making them less abstract than aggregated statistics. Let’s consider, first, an example from Reuters. In their article Scarr and Hernandez (2019), the authors encode data as individual images of plastic bottles collecting over time, Figure 4.2, also making comparisons between the collections and familiar references, to demonstrate the severity of plastic misuse.
From a persuasive point of view, how does this form of data encoding compare with their secondary graphic, see Figure 4.3, in the same article:
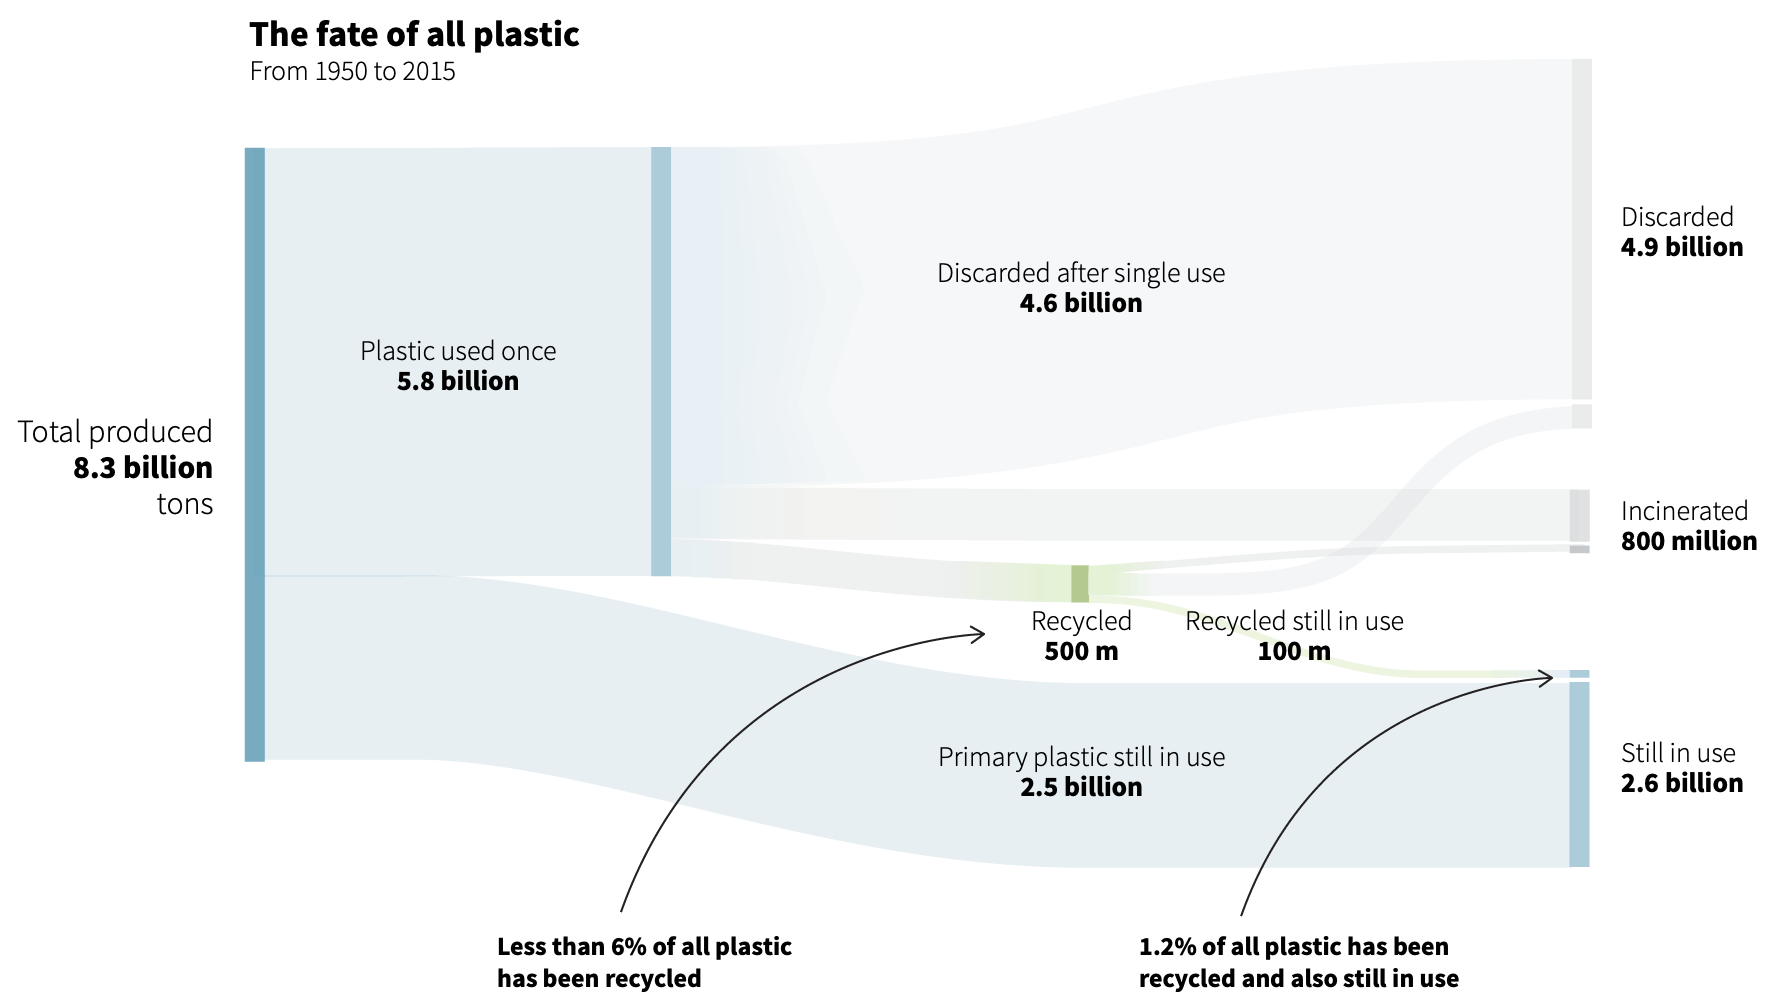
Exercise 4.7 Do the two graphics intend to persuade in different ways? Explain.
Here’s another example from news, the New York Times. Manjoo (2019) represents each instance of tracking an individual who browsed various websites. Figure 4.4 represents a snippet from the full information graphic. The full graphic concretizes each instance of being tracked. Notice each colored dot is timestamped and labeled with a location. The intended effect is to convey an overwhelming sense to the audience that online readers are being watched — a lot.
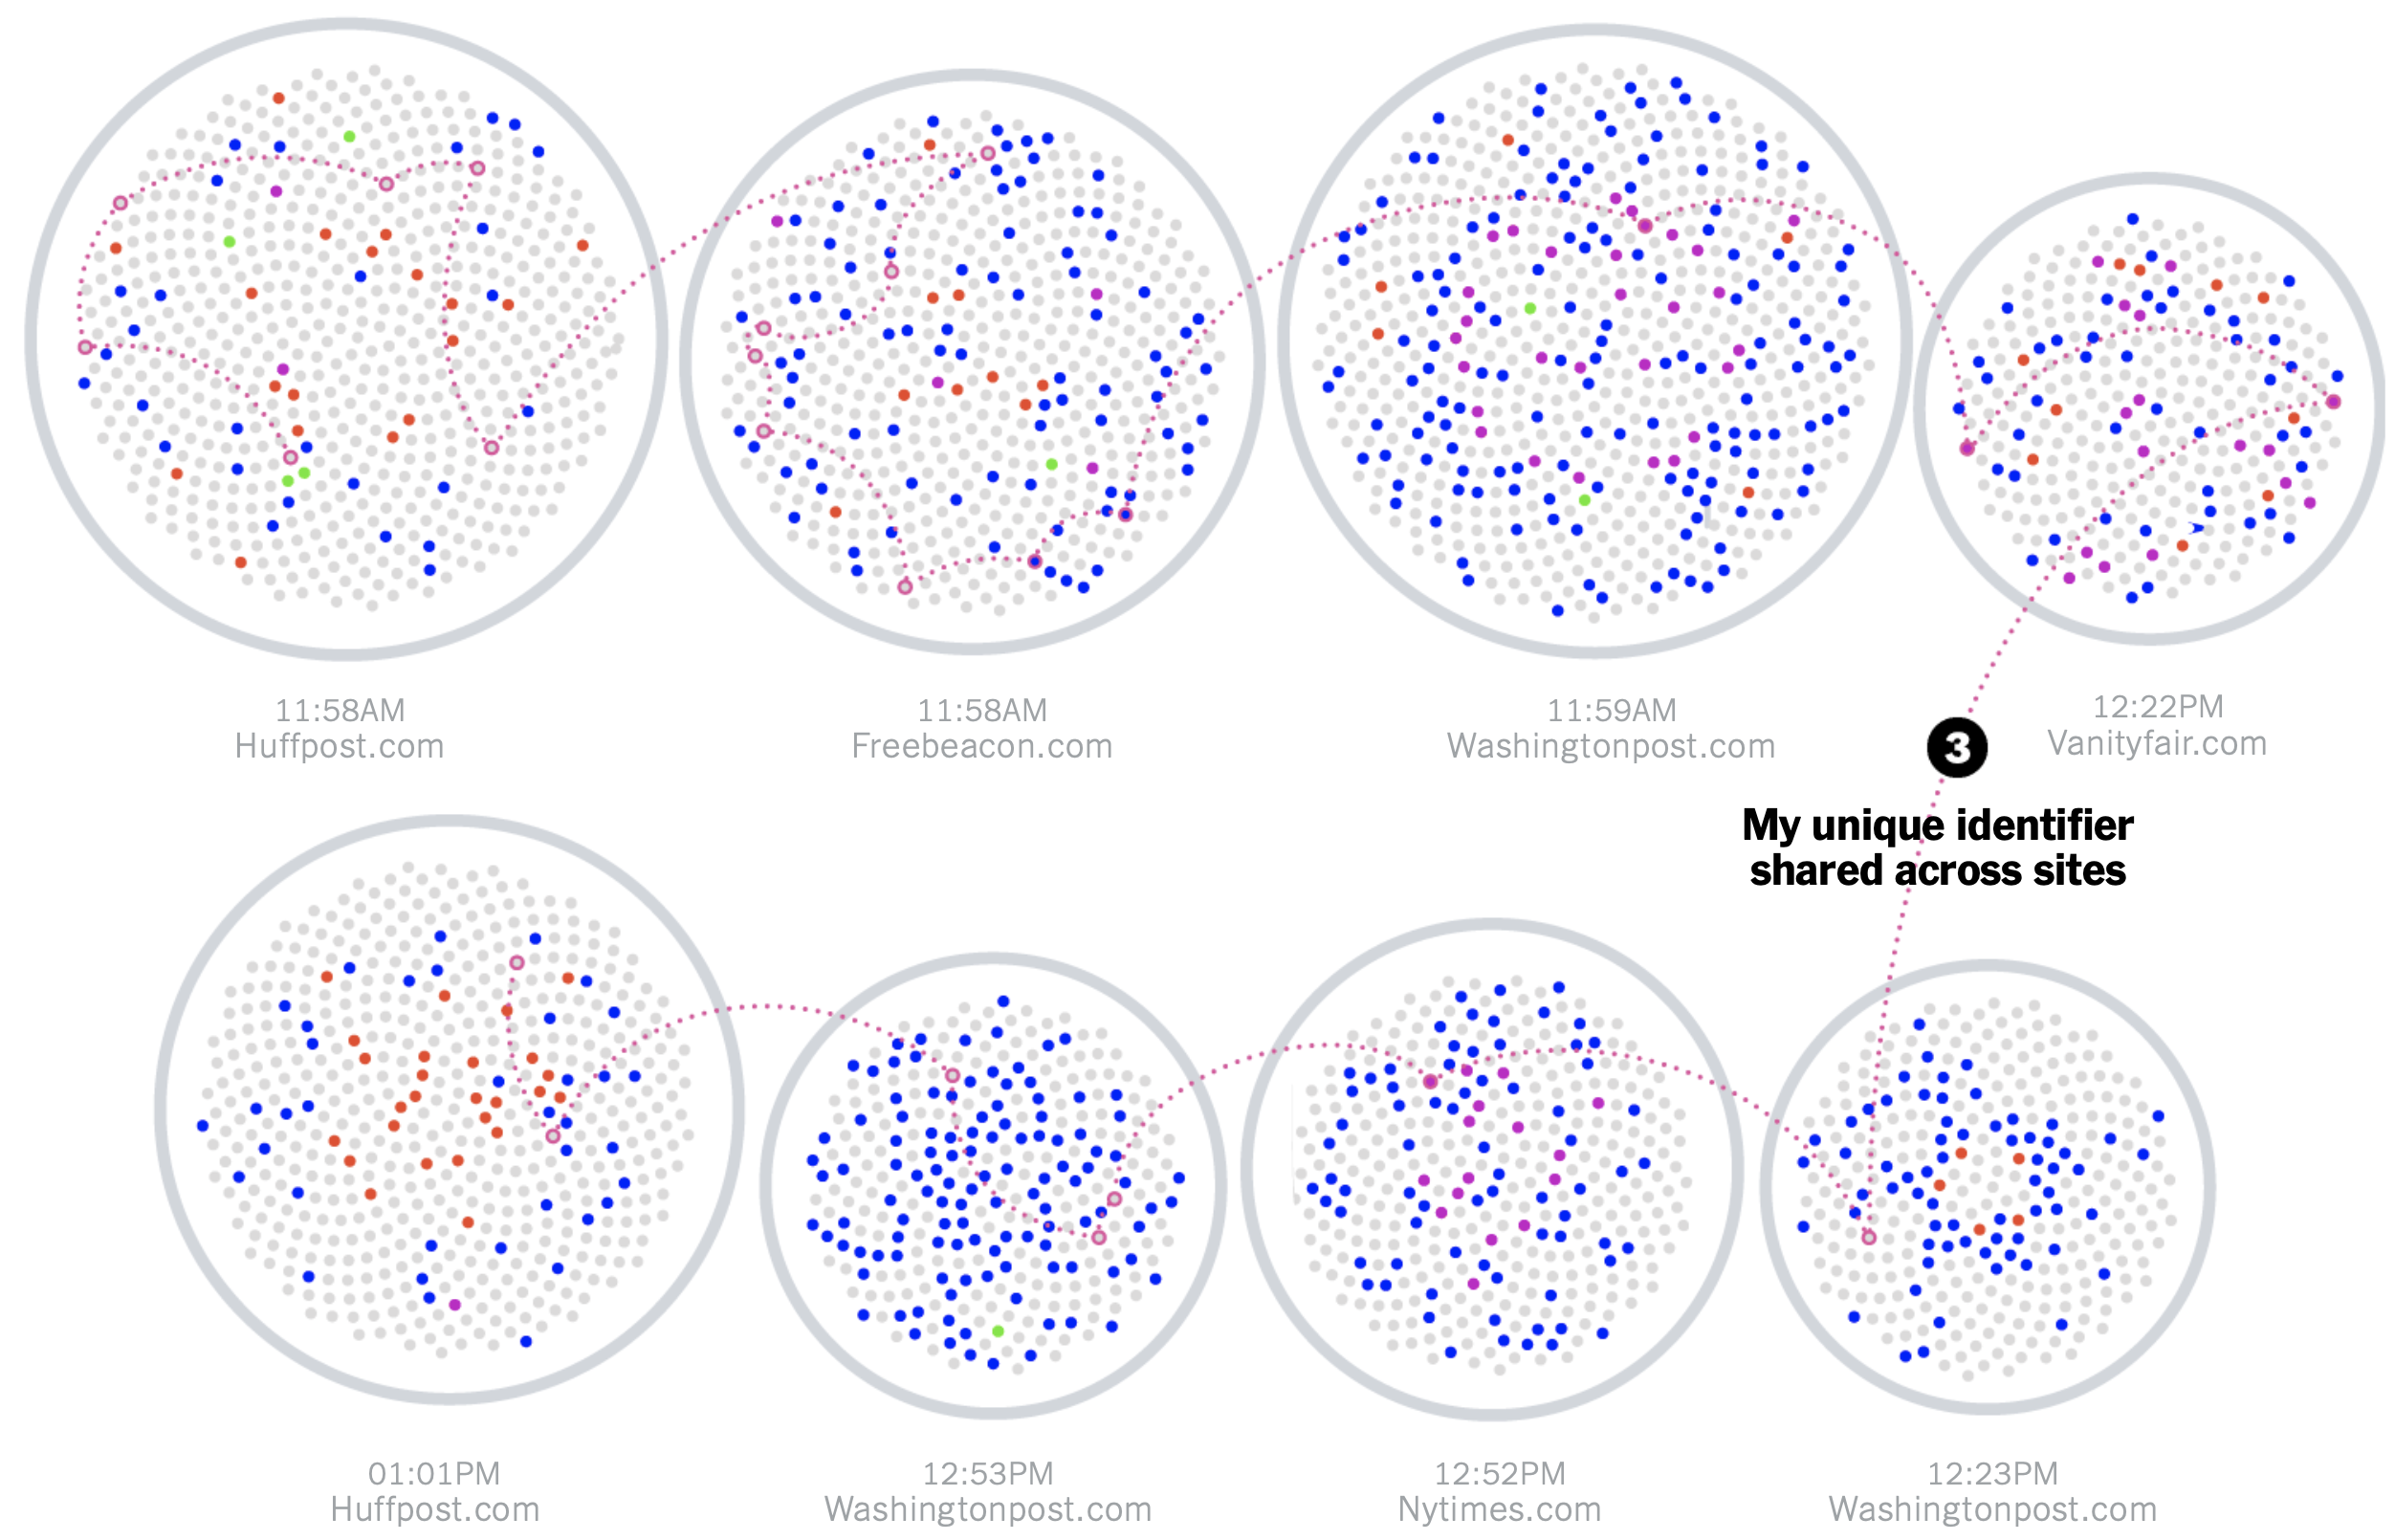
Review the full infographic and consider whether the use of concretizing each timestamped instance, labeled by location, heightens the realization of being tracked more than just reading the more abstract statement that “hundreds of trackers followed me.”
Like concretizing, repetition is an established pattern for argumentation. Repetition can increase a message’s importance and memorability, and can help tie together different arguments about a given data set. Repetition can be employed as a means to search for an answer in the data. Let’s consider another information graphic, which exemplifies this approach. Roston and Migliozzi (2015) uses several rhetorical devices intended to persuade the audience that greenhouse gasses cause global warming. A few of the repeated graphics and questions are shown in Figure 4.5, reproduced from the article.

4.9 Statistical persuasion
Let’s consider, now, how statistics informs persuasion.
4.9.1 Comparison is crucial
We’ve touched upon the importance of comparison. Tufte (2006) explains the centrality of comparison, “The fundamental analytical act in statistical reasoning is to answer the question ‘Compared with what?’”
Abelson (1995), too, forcefully argues that comparison is central: “The idea of comparison is crucial. To make a point that is at all meaningful, statistical presentations must refer to differences between observation and expectation, or differences among observations.” Abelson tests his argument through a statistical example,
The average life expectancy of famous orchestral conductors is 73.4 years.
He asks: Why is this important; how unusual is this? Would you agree that answering his question requires some standards of comparison? For example, should we compare with orchestra players? With non-famous conductors? With the public? With other males in the United States, whose average life expectancy was 68.5 at the time of the study reported by Abelson? With other males who have already reached the age of 32, the average age of appointment to a first conducting post, almost all of whom are male? This group’s average life expectancy was 72.0.
4.9.2 Elements of statistical persuasion
Several properties of data, and its analysis and presentation, govern its persuasive force. Abelson describes these as magnitude of effects, articulation of results, generality of effects, interestingness of argument, and credibility of argument: MAGIC.
Magnitude of effects. The strength of a statistical argument is enhanced in accord with the quantitative magnitude of support for its qualitative claim. Consider describing effect sizes like the difference between means, not dichotomous tests. The information yield from null hypothesis tests is ordinarily quite modest, because all one carries away is a possibly misleading accept-reject decision. To drive home this point, let’s model a realization from a linear relationship between two independent, random variables \(\textrm{normal}(x \mid 0, 1)\) and \(\textrm{normal}(y \mid 1, 1)\) by simulating them in R as follows:
set.seed(9)
y <- rnorm(n = 1000, mean = 1, sd = 1)
x <- rnorm(n = 1000, mean = 0, sd = 1)
And model them using a linear regression,
model_fit <- lm(y ~ x)Results in a “statistically significant” p-value:
| term | estimate | std.error | statistic | p.value |
|---|---|---|---|---|
| (Intercept) | 1.0051706 | 0.0303137 | 33.158912 | 0.0000000 |
| x | -0.0627763 | 0.0305902 | -2.052173 | 0.0404133 |
Yet we know there is no actual relationship between the two variables. p-values say little, and can mislead. Here’s what a p-value of less than, say, 0.01 means:
If it were true that there were no systematic difference between the means in the populations from which the samples came, then the probability that the observed means would have been as different as they were, or more different, is less than one in a hundred. This being strong grounds for doubting the viability of the null hypothesis, the null hypothesis is rejected.
More succinctly we might say it is the probability of getting the data given the null hypothesis is true: mathematically, \(P(\textrm{Data} \mid \textrm{Hypothesis})\). There are two issues with this. First, and most problematic, the threshold for what we’ve decided is significant is arbitrary, based entirely upon convention pulled from a historical context not relevant to much of modern analysis.
Secondly, a p-value is not what we usually want to know. Instead, we want to know the probability that our hypothesis is true, given the data, \(P(\textrm{Hypothesis} \mid \textrm{Data})\), or better yet, we want to know the possible range of the magnitude of effect we are estimating. To get the probability that our hypothesis is true, we also need to know the probability of getting the data if the hypothesis were not true:
\[ P(\textrm{H} \mid \textrm{D}) = \frac{P(\textrm{D} \mid \textrm{H}) P(\textrm{H})}{P(\textrm{D} \mid \textrm{H}) P(\textrm{H}) + P(\textrm{D} \mid \neg \textrm{H}) P(\neg \textrm{H})} \]
Decisions are better informed by comparing effect sizes and intervals. Whether exploring or confirming analyses, show results using an estimation approach — use graphs to show effect sizes and interval estimates, and offer nuanced interpretations of results. Avoid the pitfalls of dichotomous tests2 and p-values. Dragicevic (2016) writes, “The notion of binary significance testing is a terrible idea for those who want to achieve fair statistical communication.” In short, p-values alone do not typically provide strong support for a persuasive argument. Favor estimating and using magnitude of effects. Let’s briefly consider the remaining characteristics that Abelson describes of statistical persuasion. These:
Articulation of results. The degree of comprehensible detail in which conclusions are phrased. This is a form of specificity. We want to honestly describe and frame our results to maximize clarity (minimizing exceptions or limitations to the result) and parsimony (focusing on consistent, connected claims).
Generality of effects. This is the breadth of applicability of the conclusions. Over what context can the results be replicated?
Interestingness of argument. For a statistical story to be theoretically interesting, it must have the potential, through empirical analysis, to change what people believe about an important issue.
Credibility of argument. Refers to believability of a research claim, requiring both methodological soundness and theoretical coherence.
Let’s get back to the ever-important concept of comparison.
In language describing quantities, we have two main ways to compare. One form is additive or subtractive. The other is multiplicative. We humans perceive or process these comparisons differently. Let’s consider an example from Andrews (2019):
The Apollo program crew had one more astronaut than Project Gemini. Apollo’s Saturn V rocket had about seventeen times more thrust than the Gemini-Titan II.
We process the comparative language of “seventeen times more” differently than “1,700 percent more” or “33 versus 1.9”. Add and subtract comparisons are easier for people to understand, especially with small numbers. Relative to additive comparisons, multiplying or dividing are more difficult. This includes comparisons expressed as ratios: a few times more, a few times less. People generally try to interpret multiplying operations through pooling, or repeat addition.
In Andrews’s example, it may be better to show a graphical comparison,

Statistics and narrative.
We’ve discussed narrative and statistics as forms of persuasion. And we’ve seen examples of their combination. Is the combination more persuasive than either individual form? Some researchers have claimed that the persuasive effect depends on the data and statistics. Krause and Rucker (2020) argue from an empirical study that narrative can improve less convincing data or statistics, but may actually detract from strong numerical evidence. Their study involved survey responses from participants that reviewed \(a_1\)) less favorable data (a phone that was relatively heavy and shatter-tested in a 3-foot drop) in the form of a list and \(a_2\)) the same data embedded within a narrative. The data was then changed to be more favorable (a phone that was relatively light and shatter-tested in a 30-foot drop) and \(b_1\)) placed into a list and \(b_2\)) the same, more favorable data was embedded within the same narrative. When comparing responses involving the less-favorable data, the researchers found that the narrative form positively influenced participants relative to presenting the data alone. But when comparing responses involving the more favorable data, the relationship reversed. Respondents was more swayed by the data alone than when presented with it embedded within the narrative. Of note, there was no practical (or significant) difference in responses between narratives with either data. They conclude, from the study, that narratives operate by taking the focus off the data, which may either help or harm a claim, depending on the strength of the data.
But a review of the actual narrative created for the study reveals that the narrative was not about the thing generating the data (a phone and its properties). Instead, the narrative was about a couple hiking that encountered an emergency and used the phone during the emergency. In other words, the data of the phone characteristics amounted to what the advertising industry might call a “product placement.” Product placements, of course, have been found to be effective in transferring sentiment about the narrative to sentiment about the product. But it would be dangerous to generalize from this empirical study to potential effects and operations of other forms of narrative. Instead of choosing between listing convincing data on its own or embedding it as a product placement, we should consider providing narrative context focused on the data and thing that generated it. In other words, we can create a narrative that emphasizes the data, instead of shifting our audiences’ focus from the data. And we can create that narrative context using metaphor, simile, and analogy, discussed next.
4.10 Comparison through metaphor, simile, analogy
Metaphor adds to persuasiveness by reforming abstract concepts into something more familiar to our senses, signaling particular aspects of importance, memorializing the concept, or providing coherence throughout a writing3. The abstract concepts we need help explaining, ideas we need to make important, or the multiple ideas we need to link, we call the target domain. Common source domains include the human body, animals, plants, buildings and constructions, machines and tools, games and Sport, money, cooking and food, heat and cold, light and darkness, and movement and direction. Let’s consider some examples.
In a first example, we return to Andrews (2019). As a book-length communication, it has more space to build the metaphor, and does so borrowing from the source domain of music:
How do we think about the albums we love? A lonely microphone in a smoky recording studio? A needle’s press into hot wax? A rotating can of magnetic tape? A button that clicks before the first note drops? No!
The mechanical ephemera of music’s recording, storage, and playback may cue nostalgia, but they are not where the magic lies. The magic is in the music. The magic is in the information that the apparatuses capture, preserve, and make accessible. It is the same with all information.
After setting up this metaphor, he repeatedly refers back to it as a form of shorthand each time:
When you envision data, do not get stuck in encoding and storage. Instead, try to see the music. … Looking at tables of any substantial size is a little like looking at the grooves of a record with a magnifying glass. You can see the data but you will not hear the music. … Then, we can see data for what it is, whispers from a past world waiting for its music to be heard again.
What, if anything, do you think use of this source domain adds to the audiences understanding of data and information? For other uses of simile and metaphor for data analytics concepts, see McElreath (2020), using mythology (a golem) to represent properties of statistical models, Rosenbaum (2017), using poetry about a road not taken, Frost (1921) to explain how we think about, and the properties of, co-variates.
Exercise 4.8 Find other examples of metaphor and simile used to describe data science concepts. Do you believe they aide understanding for any particular audience(s)? Explain.
4.11 Patterns that compare, organize, grab attention
We can use patterns to “make the words they arrange more emphatic or memorable or otherwise effective” (Farnsworth 2011). In Classical English Rhetoric, Farnsworth provides a wealth of examples, categorized. Unexpected word placement calls attention to them, creates emphasis by coming earlier than expected or violating the reader’s expectations. Note that, to violate expectations necessarily means reserving a technique like inversion for just the point to be made, lest the reader come to expect it — more is less, less is more. Secondly, it can create an attractive rhythm. Thirdly, when the words that bring full meaning come later, it can add suspense, and finish more climactic.
These patterns can be the most effective and efficient ways to show comparisons and contrasts. While Farnsworth provides a great source of these rhetorical patterns in more classical texts, we can find plenty of usage in something more relevant to data science. In fact, we have already considered a visual form of repetition in Section 4.8. Let’s consider example structure (reversal of structure, repetition at the end) used in another example text for data science, found in Rosenbaum (2017):
A covariate is a quantity determined prior to treatment assignment. In the Pro-CESS Trial, the age of the patient at the time of admission to the emergency room was a covariate. The gender of the patient was a covariate. Whether the patient was admitted from a nursing home was a covariate.
The first sentence begins “A covariate is …” Then, the next three sentences reverse this sentence structure, and repeat to create emphasis and nuance to the reader’s understanding of a covariate. Here’s another pattern (Repetition at the start, parallel structure) from Rosenbaum’s excellent book:
One might hope that panel (a) of Figure 7.3 is analogous to a simple randomized experiment in which one child in each of 33 matched pairs was picked at random for exposure. One might hope that panel (b) of Figure 7.3 is analogous to a different simple randomized experiment in which levels of exposure were assigned to pairs at random. One might hope that panels (a) and (b) are jointly analogous to a randomized experiment in which both randomizations were done, within and among pairs. All three of these hopes may fail to be realized: there might be bias in treatment assignment within pairs or bias in assignment of levels of exposure to pairs.
Repetition and parallel structure are especially useful where, as in these examples, the related sentences are complex or relatively long. Let’s consider yet another pattern (asking questions and answering them):
Where did Fisher’s null distribution come from? From the coin in Fisher’s hand.
Rhetorical questions or those the author answers are a great way to create interest when used sparingly. In your own studies, seeing just a few examples invites direct imitation of them, which tends to be clumsy when applied. Immersion in many examples, however, allows them to do their work by way of a subtler process of influence, with a gentler and happier effect on our resulting style of narrative.
4.12 Le mot juste — the exact word
Writing poetically, Goodman (2008) explains the importance of finding the exact word. Le mot juste, in French, is how it’s expressed.
In our search we must also keep in mind, and use, words with the appropriate precision, as Alice explains:
“When I use a word,” Humpty Dumpty said in rather a scornful tone, “it means just what I choose it to mean—nothing more nor less.”
“The question is,” said Alice, “whether you can make words mean so many different things” (Carroll 2013).
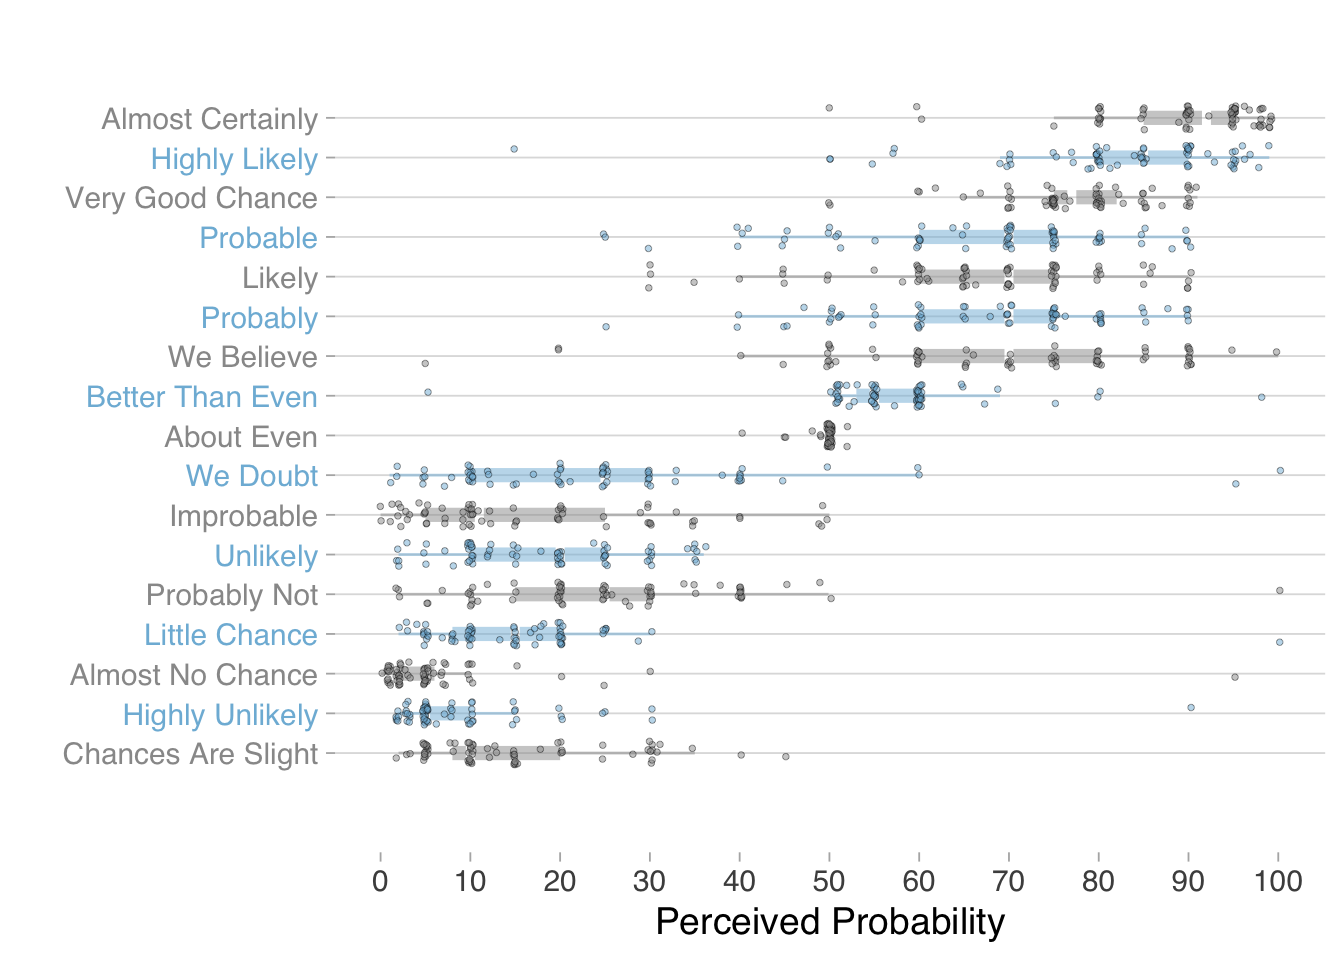
Yet empirical studies suggest variation in our understanding of words that express quantity. For words meant to convey quantity, their meanings vary more than Alice would like. Barclay et al. (1977) reports survey responses from 23 NATO military officers who were asked to assign probabilities to particular phrases if found in an intelligence report. In another, online survey of 46 individuals, zonination (2015) provided responses to the question: What [probability/number] would you assign to the phrase [phrase]? where the phrases matched those of the NATO study. The combined responses in Figure 4.7 show wide variation in what probabilities individuals associate with words, although some ordering or ranking is evident.
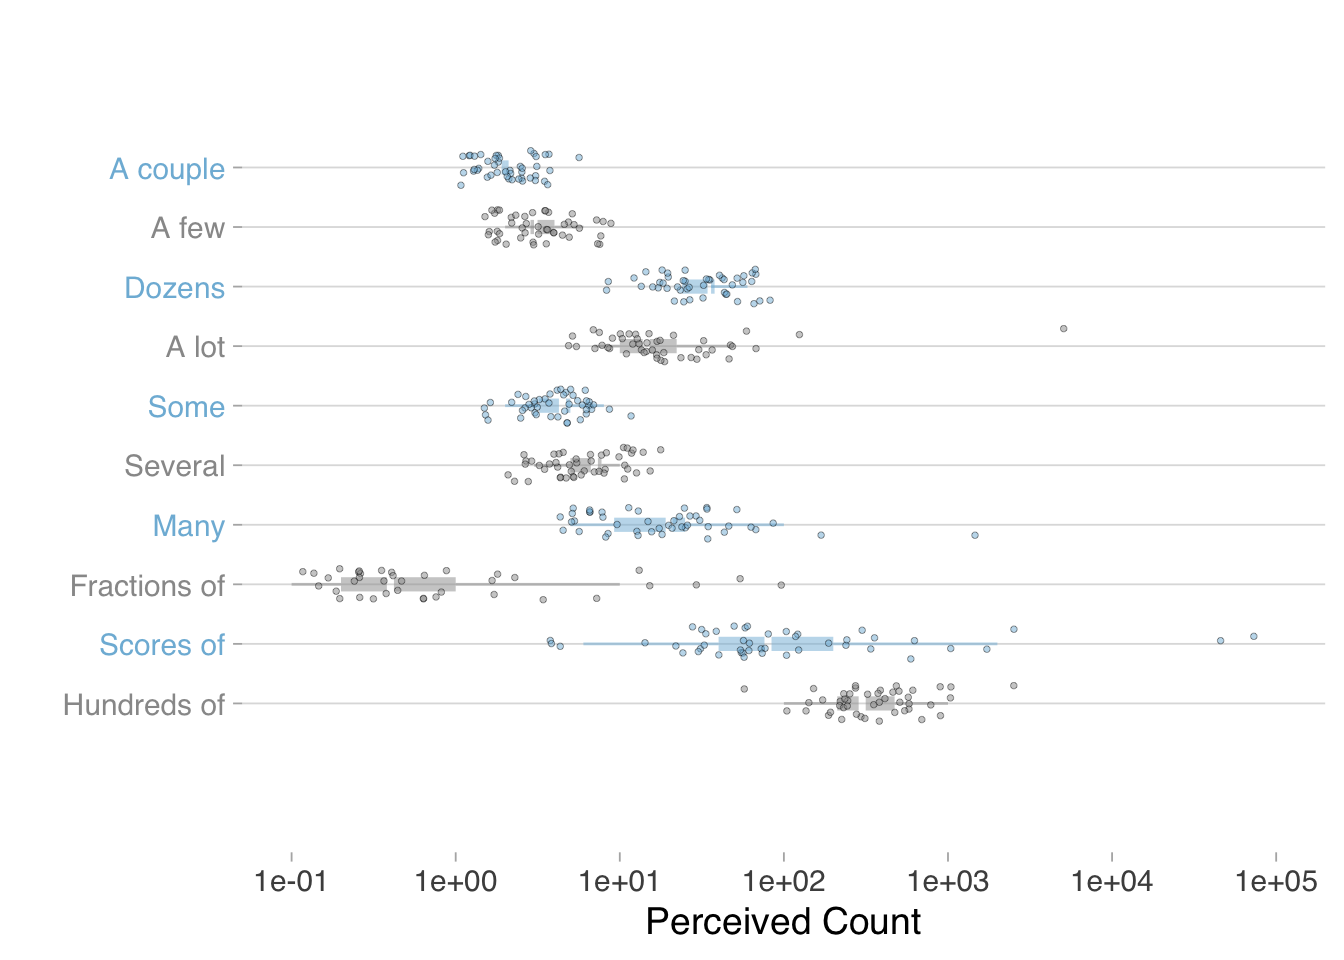
As with variation in probabilities assigned to words about uncertainty, the empirical study suggests variation in amounts assigned to words about size, shown in Figure 4.8.
Variance in perception of the meaning of such words does not imply we should avoid them altogether. It does mean, however, we should be aware of the meaning others may impart and complement our use of them with numerals or graphic displays.
Orwell (2017), for example, argues against political tyranny.↩︎
Indeed, we are being warned to abandon significance tests (McShane et al. 2019).↩︎
Seminal works on metaphor include (Farnsworth 2016); (Kövecses 2010); (Ricoeur 1993); (Lakoff and Johnson 1980).↩︎