
20 Technology for interactivity
20.1 Understanding what your AI partner is doing
Throughout this book, we have explored how to specify interactive graphics for implementation by AI systems. We have learned to describe what we want—hover effects, linked views, filtering mechanisms—and let large language models translate those specifications into working code. This approach empowers analysts who may not have deep programming expertise to create sophisticated interactive visualizations.
But here is a truth that will make you more effective: the AI is not magic. It is translating your specifications into standard web technologies that have existed for decades. When you ask for a tooltip on hover, the AI writes JavaScript that listens for mouse events and modifies HTML elements. When you request a color change on selection, the AI generates CSS rules that update styling properties. Understanding what the AI is doing—even at a high level—makes you a better collaborator.
Think of it like working with a skilled carpenter. You might design a house without knowing how to cut joinery yourself, but understanding that wood expands with humidity, that certain joints are stronger than others, and that load-bearing walls require particular support helps you design structures that can actually be built. Similarly, understanding that web pages are built from HTML structure, CSS styling, and JavaScript behavior helps you write specifications that the AI can implement successfully.
This chapter provides a tour of the technologies underlying interactive graphics. We will examine the modern web stack—HTML for structure, CSS for styling, SVG for vector graphics, and JavaScript for interactivity. We will see how these pieces fit together to create the experiences we have been specifying. Our goal is not to make you a web developer; it is to make you a more informed director of AI-assisted development.
Consider what happens when you ask an LLM to “create an interactive scatterplot where hovering over points shows details about that observation.” The AI generates code that:
- Creates an HTML page to hold the graphic
- Uses SVG to draw the scatterplot points and axes
- Writes CSS to style the points, axes, and tooltip
- Programs JavaScript to listen for mouse movements, detect when the cursor hovers over a point, and display a tooltip with the observation’s details
Each of these steps involves specific technologies with particular capabilities and constraints. Understanding these basics helps you write better specifications. You will know that “show details on hover” requires the browser to track mouse position, which means the points must be individual SVG elements rather than a static image. You will understand why responsive sizing requires CSS rather than fixed pixel dimensions.
The chapter that follows introduces these technologies in sequence. We begin with how browsers work, then examine the Document Object Model that structures web pages, then explore HTML for content, CSS for styling, SVG for graphics, and JavaScript for interactivity. We conclude by discussing how these technologies enable the interactive experiences we have been specifying throughout this book.
20.2 The technology landscape
Interactivity is inherently technology dependent. Modern interactive graphics rely on a technology stack that includes HTML, CSS, SVG, and JavaScript, within which specialized libraries like D3.js operate. Most award-winning interactive graphics from leading news organizations use variations of this stack.
We can also enable interactivity through higher-level interfaces. R and Python provide interactive notebooks and markdown documents. HTML widgets allow R and Python to generate JavaScript visualizations. Shiny and Plotly offer frameworks for creating interactive web applications without writing raw JavaScript. Drag-and-drop tools like Lyra2 or Tableau provide visual interfaces for building interactivity.
Each approach involves trade-offs. Raw web technologies offer maximum flexibility but require technical expertise. High-level tools like Tableau sacrifice some flexibility for accessibility. Understanding this landscape helps you choose appropriate tools for your context and audience. More importantly, it helps you collaborate effectively with technical specialists when you need capabilities beyond what automated tools provide.
20.3 A concrete example: What the AI builds
Let us ground this discussion with a concrete example. Suppose you ask an AI to create a simple interactive bar chart showing sales by region, where clicking a bar highlights it and shows detailed data below. The AI might generate something conceptually like this:
The HTML structure: A container that holds the chart title, the SVG graphic, and a details panel.
The SVG graphic: Rectangles representing each region’s sales, positioned along axes, with attributes identifying which region each bar represents.
The CSS styling: Colors for the bars, fonts for the text, positioning for the layout, and transition effects for smooth highlighting.
The JavaScript interactivity: Event listeners that detect clicks on bars, functions that change the bar’s color when clicked, and code that updates the details panel with the corresponding region’s data.
When you interact with the resulting graphic—clicking on the “North” bar, for instance—the JavaScript detects your click, identifies which bar you clicked, changes its fill color via CSS, and populates the details panel with North’s data by manipulating the HTML.
This example illustrates the division of labor among web technologies: HTML provides the structure (where things go), CSS provides the presentation (how things look), SVG provides the graphics (the visual marks), and JavaScript provides the behavior (what happens when you interact). Understanding this division helps you write clearer specifications. When you want something to change on hover, you are asking for JavaScript event handling. When you want specific colors, you are specifying CSS properties. When you want particular shapes, you are describing SVG elements.
The sections that follow examine each technology in more detail, building your understanding of what the AI is doing when it implements your specifications.
20.4 Browsers
We’ve all been using a web browser many years. I remember pre-internet days, but some of you were probably born after it already existed! Common browsers today include Safari, Chrome, and Firefox.
All of these browsers work very similarly, in that they work with your operating system, whether a computer or smart phone or smart tablet or whatever, to listen for your actions within the browser window.
These are the same actions we discussed in the previous section. The browser watches for these events, and reports the events to things in the webpage you are reading.
20.5 Document Object Model
The web pages that load into your browser are typically named html files. These are just plain text files that contain lots of different kinds of code, which we will discuss in a moment. All that plain text is organized in something called a Document Object Model1. That’s really just a fancy word to say what I’m minimally showing you in this small example. A Document Object Model, or DOM, consists of nested pairs of tags, and a tag is written as angle bracket pairs with the name or type of tag inside them:
All webpages have the first and last tag, above, with html inside them. All pages have a tag pair with the word head inside. And all pages have a tag pair with the word body inside. The tag pair <html></html> informs the browser, “hey I’m a web page, so you know what’s inside me.” The tag pair <body></body> are where we place content that our readers generally see, what the browser displays to them. And the tag pair <head></head> instructs the browser how to format, organize, and display the content, among other things, but the instructions inside <head> tags are not actually displayed. All these tags are part of the <html> specification. Let’s consider them more closely.
20.6 Hypertext Markup Language
html2 elements are added to the content of a page to describe its structure. An element consists of an opening tag, sometimes an attribute (like a class or style), content, and a closing tag:

In the above example, the <p></p> instructs the browser to structure the content as a paragraph. There are many pre-defined tag types and attributes, and we can define our own. Also, notice that, for closing tags, a forward slash / precedes the tag name, here p, signifying the end of that element. The attribute in this example is a css (cascading style sheet) class, which I’ve named cycling_team and defined between style tags. Finally, we place our content between the opening and closing tags, whether that content is text, like “Education First” in this example, or other things like data graphics.
Duckett (2011) is helpful for the basics of html and css, which we consider next.
20.7 Cascading Style Sheets
The dimensions of content in an html document, whose dimensions can be understood in terms of boxes surrounding that content, called the “box model” where, by default width and height attributes for an element relates to the content, and the remaining space around that content is specified by its padding, border, and margin:
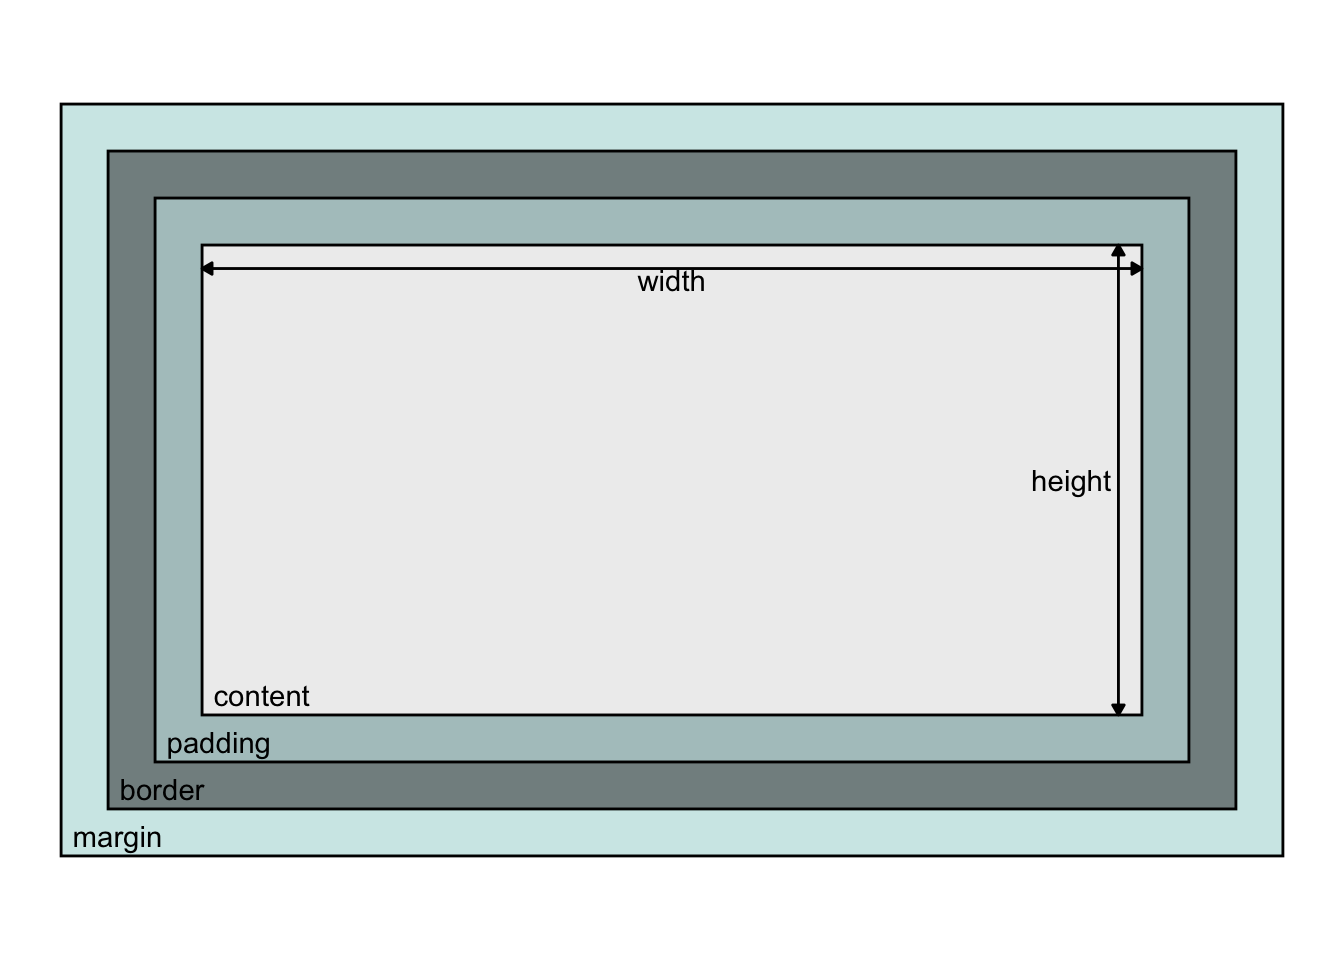
It is usually more convenient to size content by the size of the border box such that things inside shrink to fit, making combining components more predictable. This is achieved by adding box-sizing: border-box3 to css style rules.
css style rules4 Indicate how the contents of one or more elements should be displayed in the browser. Each rule has a selector and a declaration block. The selector indicates to which element(s) the rule applies. Each declaration block specifies one or more properties and corresponding values. Below, applying the class .cycling_team to a tag as an attribute,

will color the text a pink hue. css rules are specified within <style> tags:

Here, our css class sets the color of the text: Education First.
Helpful references for digging deeper into modern css include Attardi (2020); and Grant (2018). These also discuss css grid, which we consider next.
20.8 CSS grid
In earlier sections, we’ve talked about using grids to arrange things. Things like memos, proposals, and so forth. These grid are generally invisible but helps us organize and align information.
We can imagine using grids to create things like dashboards for data graphics, too. Fortunately, using grids in html pages has become straight-forward recently with advances in css, including css grid5.
As an aside, the cascading part of css means that the browser applies what you write in the order we write our classes, which means that, here, if we defined multiple classes that, say, both color text, the browser uses rules to know which thing to apply. We won’t get into the details here. Let’s consider one minimal way we can specify a css grid.
Below, we define a class .gridlayout and in that specify {display: grid;} and related properties,

Then, we use our class attributes in divider tags <div></div> to format the content. The example below displays a 2 x 3 grid of cells, each with a size specified and placed in row major order. When we create classes to format specific content — like .item or .area in this example — we include formatting information in the class. Notice that .area includes grid-column and grid-row. These refer to the boundary lines around the rows and columns where we want to place our content. When we do not specify these, like in our .item class, css grid just places the content in whatever cells are available in row-major order.
We’ll come back to grids later. First, let’s discuss the last three main technologies used for document object models.
20.9 Scalable Vector Graphics
Scalable vector graphics6 — svg — are human-readable descriptions of a collection of shapes or paths that the browser can display. As we’ve discussed, enlarging vector graphics, unlike raster-based graphics, will not reduce resolution. Together these paths and shapes comprise a graphic, which we place in the html document body between <svg> and </svg> tags:

Shapes I commonly use include the circle <circle>, rectangle <rect>, text <text>, path <path>, and group <g>. By the way, we can edit vector graphic shapes using software like Adobe Illustrator or Inkscape, too.
Of note, when we code our own shapes directly, like this, our directions differ from what we may be used to with data graphics. With those, we normally think about the origin as starting towards the lower, left corner and increasing to the right and up. For svgs it’s not quite the same. Values do increase as we move to the right, but unlike with how we typically read data graphics, the origin of an svg on a web page, or grid within the page, is the upper, left corner: values increase going down. That’s because browsers are more general than data graphics, and with web pages (in English, and many languages) we normally read starting in the top, left and read to the right, zig-zag down, and continue.
Within svg tags, we can place shapes.
The basic shapes7 we can make are very similar to what we use in a language like ggplot, the code is just a bit differently written. Recalling the most common shapes I use, a <circle> uses parameters like ggplot’s geom_circle() (actually this particular geometry is found in a ggplot2 extension package, ggforce). The <circle> example, below, with its attributes just require us to specify the center as an cx, cy coordinate location, and a radius r, then specify attributes like stroke (color), fill, stroke-width, and opacity of the fill or line to alter how it looks:


Along with <circle>, svg provides a <rect>, with attributes like geom_rect(), a <text>, like geom_text(), and a <path>, like geom_path(). And, as with ggplot’s geoms, we can change svg shape attributes like line color, fill color, stroke width, opacity, and so forth.
Because <path>8 is a little more involved, let’s consider it too. Here’s an example:

If you have ever drawn pictures by connect-the-dots, we code an svg <path> like that: a path tag or a path shape is a connect-the-dots, written as a string of letters and coordinates that we assign to the d attribute.
When we start a drawing, before we touch our pencil to paper, we locate the dot marked number 1. In svg code, that’s the command move to, or Mx,y, where x and y are the coordinates where we first put the pencil to paper. Once the pencil touches the paper, we move our pencil to the next x, y coordinate location. That’s the L command in the string above, which means “line to”. And that creates a straight line. Thus, in the above example, our “pencil” made four straight lines forming a rectangle.
Finally, we can make the line curve, the “curve to” command C, not shown in the above example. Now this command takes some practice to get well.
The curve to command, has three x, y coordinate locations. The first two coordinates are “levers” I’ve colored blue and purple here:

The last x, y coordinate for curve to C is just like the Lx,y location: it’s the final place we move our pencil.
Now, svg has significantly more functionality, but that’s all we will discuss for now. And this concludes the basics of how vector shapes are made by other programs under the hood, like ggplot.
Bellamy-Royds, Cagle, and Storey (2018) provides helpful guidance for svg.
20.10 Canvas
When performance drawing svg shapes becomes an issue—which may occur on slower computers with 1,000 to 10,000 shapes, more with today’s computers—we gain performance by switching to raster graphics. For raster graphics, we draw pixels on canvas9, which we specify within html using the <canvas></canvas> tag, shown below. From pixels, we cannot select shapes or paths like we can with svg graphics, and resolution drops upon zooming into the canvas. If for vector shapes we can edit with Inkscape, for edit rasters, edit with something like Photoshop. Here’s an example <canvas> tag:

20.11 Javascript
Now, html, css, css grid, svg, and canvas all work together to create what you see on the web page. To make them interactive, in other words to change the content or formatting we see, the browser runs code called javascript10. Javascript is a programming language that we (or our software tools) can code to listen for our (inter)actions, and react by changing the html or css or svg or whatever is needed to update in the interacted webpage.
We can bind elements to events that, upon happening, trigger javascript code, which in turn can modify content: html elements and attributes, svg or canvas, or css style. Really it can modify anything in the DOM. As with R packages that abstract and ease our application of specialized functionality, easing the burden of writing code, many javascript libraries are available to do the same.
Here is generic code to bind listeners to elements that trigger changes through functions:

Now the very basic code I’m showing above gets to the heart of how interactivity works. In javascript, we can search the DOM for a named html element or tag, and assign it as an object, here we named it element. And javascript let’s us do things to that object through functions attached to the object (this is an object-oriented programming framework). Here, the function is generically called onevent, but the event part is a placeholder for actions; here are a few specific functions: onclick, or onmouseover, or onkeypress. Our actions. The function watches for our action, on the bound element, and when it sees the action, it calls whatever function is assigned. Here I have generically called it the function functionName. And that function then does things we code, like adding a new tag element, or removing one, or changing a stroke width, or color, or really whatever we want to happen.
And that, on a very simple level, is basically how we achieve interactivity. Now as applied analysts, we may not be coding in javascript directly. Instead, some of our analysis software does, which we discuss next.
To go deeper into javascript, consult Duckett, Ruppert, and Moore (2014) for a basic understanding and Arslan (2018) for a modern, more thorough treatment.
20.12 From understanding to action
Let us step back and remember why we walked through these technologies. You do not need to become a web developer to create effective interactive graphics. The AI can handle the implementation details. But understanding what the AI is doing—recognizing that your “hover effect” requires JavaScript event listeners, that your “color change” involves CSS properties, that your “responsive layout” needs CSS Grid—makes you a more effective collaborator.
Think of this chapter as learning the vocabulary of a skilled craftsperson. You can design a house without knowing how to cut every joint, but knowing that wood expands, that walls bear loads, and that certain materials weather differently helps you design structures that can actually be built and will stand the test of time. Similarly, knowing that web graphics are built from HTML structure, CSS styling, SVG shapes, and JavaScript behavior helps you write specifications that the AI can implement successfully.
This understanding also helps you troubleshoot when things go wrong. When a tooltip does not appear, you will know to check whether the SVG elements are properly selectable. When a layout breaks on mobile, you will understand that CSS responsive design is the issue. When performance lags with thousands of points, you will recognize the trade-off between SVG and Canvas. These are not debugging details you need to fix yourself—they are diagnostic categories that help you ask the AI the right questions.
Most importantly, this foundation frees you to focus on what matters: the analytical story you want to tell and the experience you want your audience to have. You can specify interactions with confidence, knowing what is possible and what the constraints are. You can collaborate with technical specialists when you need capabilities beyond what automated tools provide, speaking their language enough to communicate your vision effectively.
20.13 Looking ahead
The technologies we have examined—HTML, CSS, SVG, JavaScript—are the building blocks, but they are not the tools you will wield directly. In the next chapter, we turn to specification itself as your primary instrument. You will learn how to craft prompts that translate your analytical vision into working interactive graphics, not by describing code, but by describing intent.
We will explore how to specify what you want your audience to experience: what they should discover when they hover, what comparisons they should make when they filter, what patterns should emerge when they explore. You will learn to write specifications that capture not just the mechanics of interaction, but the meaning behind them—the questions your visualization should answer, the insights it should reveal, the decisions it should support.
The AI will continue to be your implementation partner, translating your specifications into the HTML, CSS, SVG, and JavaScript we have examined. But your focus will shift from understanding those technologies to mastering the art of specification itself. You will learn to describe interactions that serve your analytical goals, to choose the right interactive techniques for your data and audience, and to iterate on your designs with the confidence that comes from knowing what is possible.
The foundation you have built in this chapter—understanding the web technology stack—will serve you well as we move forward. But now it is time to look beyond the building blocks to the craft of designing experiences with them.
See MDN Web Docs. CSS.↩︎