Slide 18
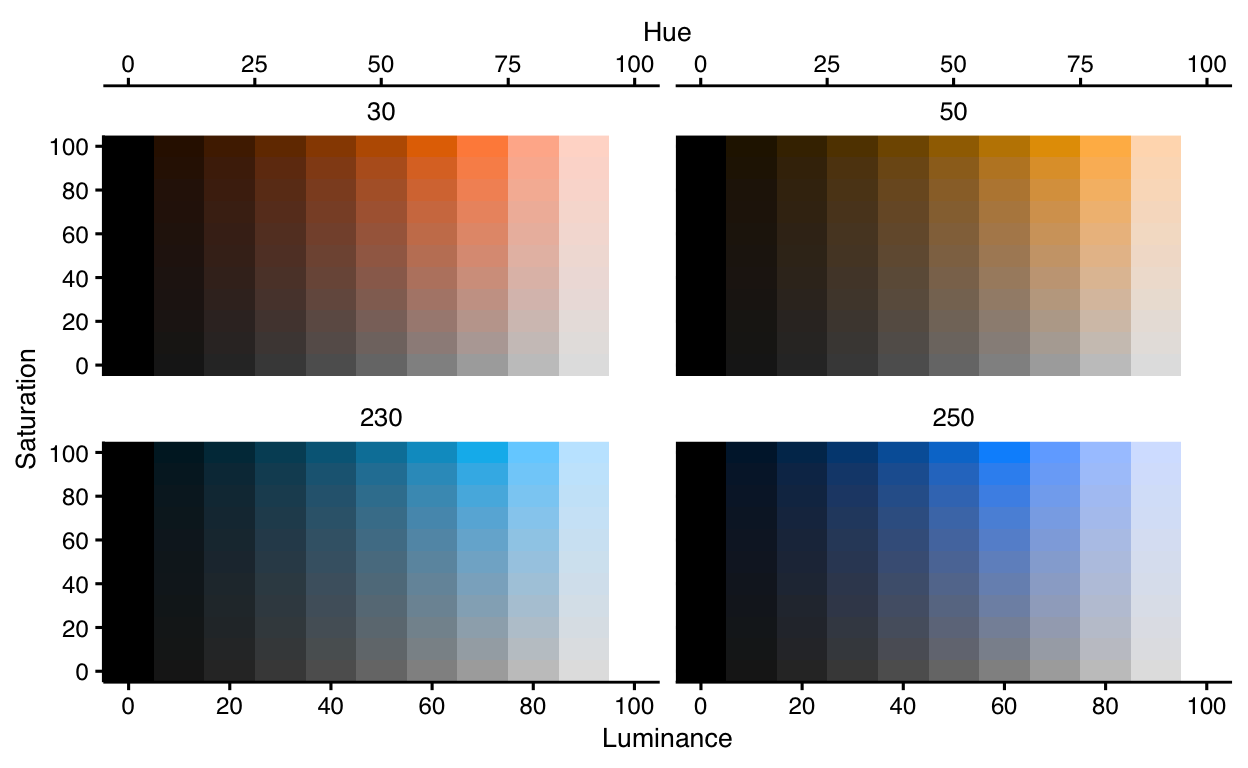
library(HSLuv)

df <- expand.grid(
  H = c(30, 50, 230, 250),
  S = seq(0, 100, by = 10),
  L = seq(0, 100, by = 10))

library(scales)

df <- df %>%
  mutate(
    H = rescale(H, from = c(0, 360), to = c(0, 360) ),
    S = rescale(S, from = c(0, 100), to = c(0, 100) ),
    L = rescale(L, from = c(0, 100), to = c(0, 100) ))

ggplot(df) +

  facet_wrap(~ H ) +

  scale_x_continuous(
    name = 'Luminance',
    breaks = seq(0, 100, by = 20),
    expand = c(0,0),
    sec.axis = sec_axis(~., name = 'Hue')) +

  scale_y_continuous(
    name = 'Saturation',
    breaks = seq(0, 100, by = 20),
    expand = c(0,0)) +

  scale_fill_identity() +

  geom_raster(
    mapping = aes(
      x = L,
      y = S,
      fill = hsluv_hex(H, S, L)),
    )
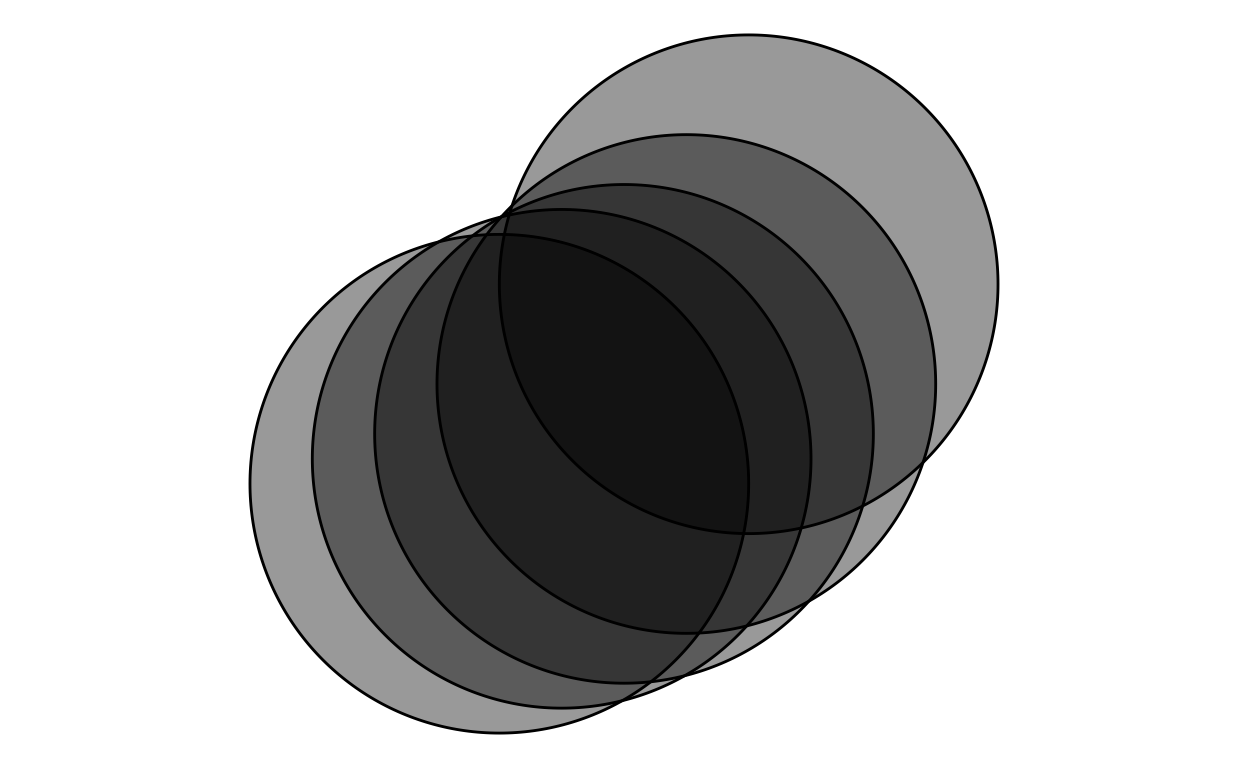
Slide 22
ggplot() +
  theme_void() +
  coord_equal() +
  ggforce::geom_circle(
    mapping = aes(
      x0 = seq(from = 0, to = 1, length.out = 5),
      y0 = c(0, .1, .2, .4, .8),
      r = 1),
    fill = "#000000",
    alpha = 0.4)
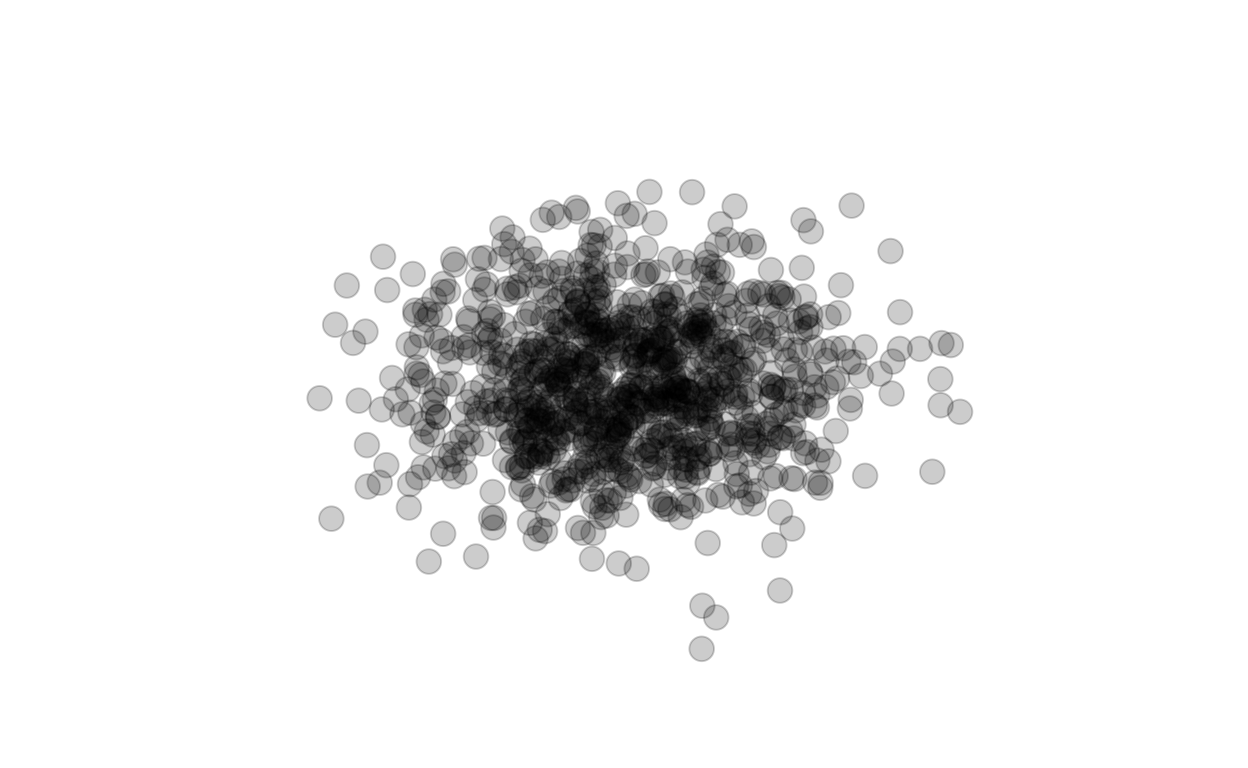
Slide 23
x <- rnorm(1000)
y <- rnorm(1000)

ggplot() +
  theme_void() +
  scale_x_continuous(limits = c(-5, 5)) +
  scale_y_continuous(limits = c(-5, 5)) +
  geom_point(
    mapping = aes(
      x = x,
      y = y),
    size = 4,
    color = "black",
    alpha = 0.2)
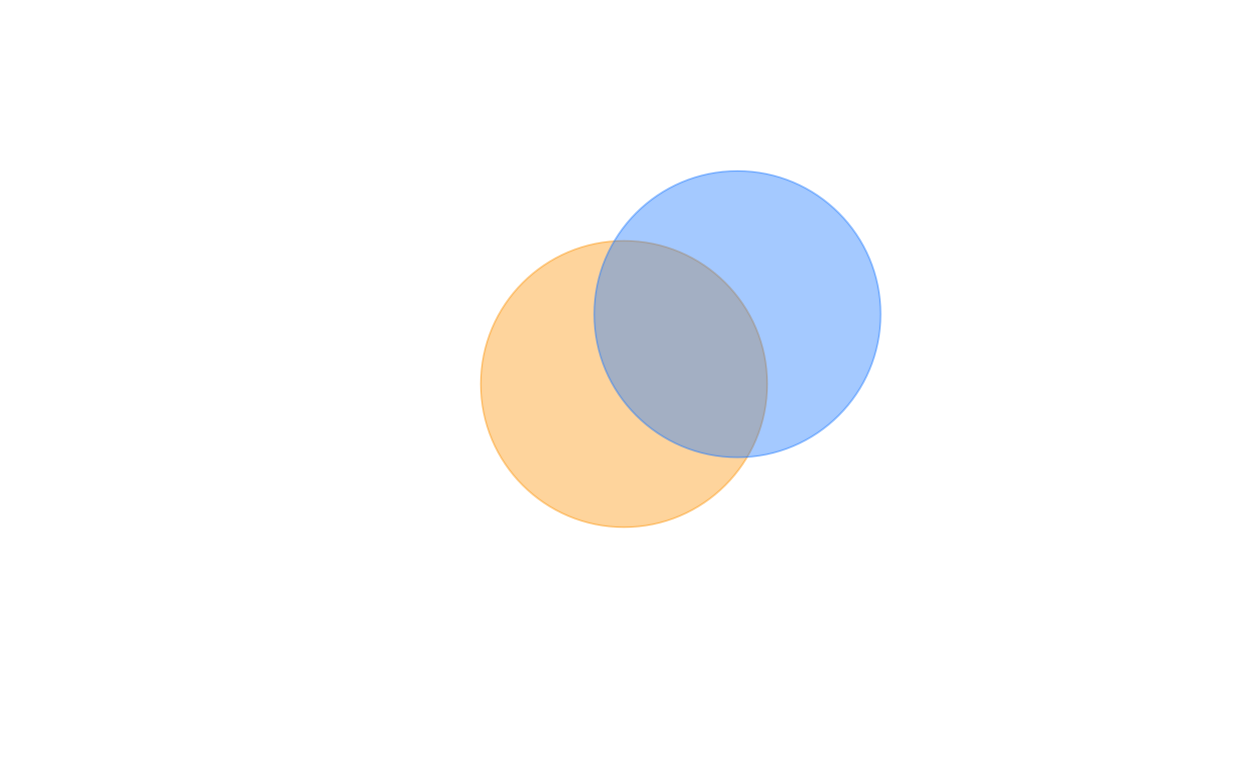
Slide 24
ggplot() +
  theme_void() +
  scale_x_continuous(limits = c(-5, 5)) +
  scale_y_continuous(limits = c(-5, 5)) +
  geom_point(
    mapping = aes(
      x = 0,
      y = 0),
    size = 50,
    color = "orange",
    alpha = 0.4) +
  geom_point(
    mapping = aes(
      x = 1,
      y = 1),
    size = 50,
    color = "dodgerblue",
    alpha = 0.4)